
Page 62 - IJB-8-2
P. 62
CFD Assessment of Extrusion Bioprinting Parameters
A B
Figure 11. Variation of (A) outlet velocity (m/s) and (B) outlet pressure (Pa) in the nozzle against time (s) for different printing speeds
through transient simulation.
A B
C
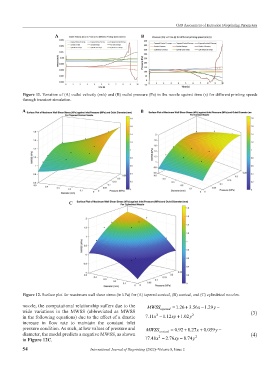
Figure 12. Surface plot for maximum wall shear stress (in kPa) for (A) tapered conical, (B) conical, and (C) cylindrical nozzles.
nozzle, the computational relationship suffers due to the MWSS = 1.26 3.56x+ − 1.29y −
wide variations in the MWSS (abbreviated as MWSS tapered (3)
in the following equations) due to the effect of a drastic 7.11x − 2 1.12xy + 1.02y 2
increase in flow rate to maintain the constant inlet
pressure condition. As such, at low values of pressure and MWSS = 0.92 8.27x+ + 0.059y −
diameter, the model predicts a negative MWSS, as shown 2 conical 2 (4)
in Figure 12C. 17.48x − 2.76xy − 0.74y
54 International Journal of Bioprinting (2022)–Volume 8, Issue 2