
Page 14 - IJB-8-3
P. 14
Ultrathin Scaffolds for Monolayer RPE Cell Culture
A B increased to 250 mm/s, fiber deposition and alignment
accuracy were greatly improved with the desired average
fiber spacing. By increasing the stage speed to 350 mm/s,
the variations of the fiber spacing were significantly
decreased as the fibers were precisely printed. With the
assistance of mechanical drawing forces, we achieved the
EHDJ printing of scaffolds with excellent fiber alignment
and desired pore sizes.
Another critical factor that affects fiber deposition
C D is the dwell time at the turning point. Since the designed
scaffolds were printed in a zigzag moving path, the stage
movement decelerates at each turning point (Figure 2B).
At this moment, the solution accumulates and deposits
on the substrate. Within a specific range, the feed rate
decreases, the jet might be distorted and affect the
fiber formation. With the increase of dwell time, the
accumulated solution or fiber will change morphology
at the turning point. Therefore, the effect of dwell time
at the turning point should be minimized (Figure 2C).
Moreover, the increasing stage speed also reduced the
effect of the accumulating solution at the deceleration
period and turning point.
3.2. Comparison of the performance of RPE
scaffolds and Transwell membrane
With the optimized printing parameters, we printed two
types of monolayer PCL scaffolds with pore sizes of
20 μm (S20) and 50 μm (S50). We propose that EHDJ-
printed PCL scaffolds could mimic the mechanical
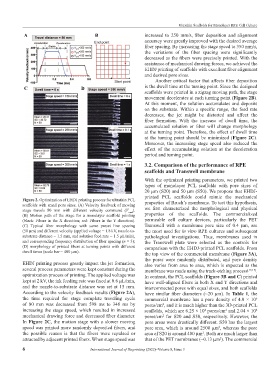
Figure 2. Optimization of EHDJ printing process for ultrathin PCL
scaffolds with small pore sizes. (A) Velocity feedback of moving properties of Bruch’s membrane. To test this hypothesis,
stage travels 80 mm with different velocity command (V ). we first characterized the morphological and physical
cmd
(B) Motion path of the stage for a monolayer scaffold printing properties of the scaffolds. The commercialized
(black: Fibers in the X direction; red: Fibers in the Y direction). permeable cell culture devices, particularly the PET
(C) Typical fiber morphology with same preset line spacing Transwell with a membrane pore size of 0.4 μm, are
(50 μm) and different velocity (applied voltage = 1.8 kV, nozzle-to- the most used for in vitro RPE cultures and subsequent
substrate distance = 1.5 mm, and solution feed rate = 1.5 μL/min), pathological investigations. Thus, membranes used in
and corresponding frequency distribution of fiber spacing (n = 3); the Transwell plate were selected as the controls for
(D) morphology of printed fibers at turning points with different comparison with the EHDJ-printed PCL scaffolds. From
dwell times (scale bar = 400 μm). the top view of the commercial membrane (Figure 3A),
the pores were randomly distributed, and pore density
EHDJ printing process greatly impact the jet formation, also varies from area to area, which is expected as the
several process parameters were kept constant during the membrane was made using the track-etching process [12,13] .
optimization process of printing. The applied voltage was In contrast, the PCL scaffolds (Figure 3B and C) printed
kept at 2 kV, the ink feeding rate was fixed at 0.6 μL/min, have well-aligned fibers in both X and Y directions and
and the nozzle-to-substrate distance was set at 15 mm. interconnected pores with equal sizes, and both scaffolds
According to the velocity feedback results (Figure 2A), have similar fiber diameters (~20 μm). In Table 1, the
the time required for stage complete traveling cycle commercial membrane has a pore density of 4.0 × 10
6
of 80 mm was decreased from 598 ms to 348 ms by pores/cm , and it is much higher than the 3D-printed PCL
2
increasing the stage speed, which resulted in increased scaffolds, which are 6.25 × 10 pores/cm and 2.04 × 10
4
4
2
mechanical drawing force and decreased fiber diameter. pores/cm for S20 and S50, respectively. However, the
2
In Figure 2C, the motion stage with a slower moving pore areas were drastically different. S50 has the largest
speed was printed more randomly deposited fibers, and pore area, which is around 2500 μm , whereas the pore
2
the possible reason is that the fibers were repulsed or area of S20 is around 400 μm . Both are much larger than
2
attracted by adjacent printed fibers. When stage speed was that of the PET membranes (~0.13 μm ). The commercial
2
6 International Journal of Bioprinting (2022)–Volume 8, Issue 3