
Page 18 - IJB-8-3
P. 18
Ultrathin Scaffolds for Monolayer RPE Cell Culture
A
B
C
D
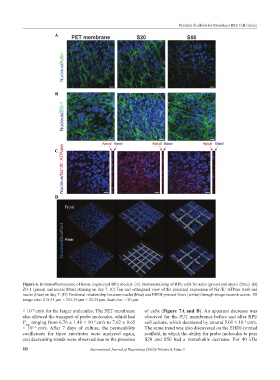
Figure 6. Immunofluorescence of tissue engineered RPE models. (A) Immunostaining of RPE cells for actin (green) and nuclei (blue). (B)
ZO-1 (green) and nuclei (blue) staining on day 7. (C) Top and orthogonal view of the polarized expression of Na /K -ATPase (red) and
+
+
nuclei (blue) on day 7. (D) Positional relationship between nuclei (blue) and EHDJ-printed fibers (white) through image reconstruction. 3D
image size: 215.55 μm × 215.55 μm × 25.25 μm. Scale bar = 20 μm.
× 10 cm s for the larger molecules. The PET membrane of cells (Figure 7A and B). An apparent decrease was
/
−6
also allowed the transport of probe molecules, which had observed for the PET membranes before and after RPE
P ranging from 6.76 ± 1.48 × 10 cm s to 7.62 ± 0.65 cell culture, which decreased by around 5.01 × 10 cm s.
−6
/
−6
/
app
× 10 −-6 cm s. After 7 days of culture, the permeability The same trend was also discovered on the EHDJ-printed
/
coefficients for three substrates were analyzed again, scaffold, in which the ability for probe molecules to pass
and decreasing trends were observed due to the presence S20 and S50 had a remarkable decrease. For 40 kDa
10 International Journal of Bioprinting (2022)–Volume 8, Issue 3