
Page 17 - IJB-8-3
P. 17
Liu, et al.
A B
C
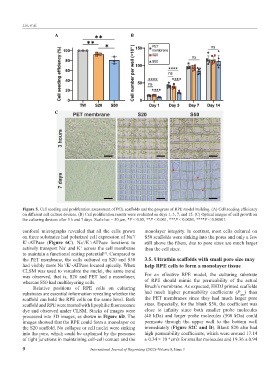
Figure 5. Cell seeding and proliferation assessment of PCL scaffolds and the progress of RPE model building. (A) Cell seeding efficiency
on different cell culture devices. (B) Cell proliferation results were evaluated on days 1, 3, 7, and 15. (C) Optical images of cell growth on
the culturing devices after 3 h and 7 days. Scale bar = 50 μm, *P < 0.05, **P < 0.001, ***P < 0.0001, ****P < 0.00001.
confocal micrographs revealed that all the cells grown monolayer integrity. In contrast, most cells cultured on
on three substrates had polarized cell expression of Na / S50 scaffolds were sinking into the pores and only a few
+
K -ATPase (Figure 6C). Na /K -ATPase functions to still above the fibers, due to pore sizes are much larger
+
+
+
actively transport Na and K across the cell membrane than the cell sizes.
+
+
to maintain a functional resting potential . Compared to
[5]
the PET membrane, the cells cultured on S20 and S50 3.5. Ultrathin scaffolds with small pore size may
had visibly more Na /K -ATPase located apically. When help RPE cells to form a monolayer tissue
+
+
CLSM was used to visualize the nuclei, the same trend
was observed, that is, S20 and PET had a monolayer, For an effective RPE model, the culturing substrate
whereas S50 had multilayering cells. of RPE should mimic the permeability of the actual
Relative positions of RPE cells on culturing Bruch’s membrane. As expected, EHDJ printed scaffolds
substrates are essential information revealing whether the had much higher permeability coefficients (P ) than
app
scaffold can hold the RPE cells on the same level. Both the PET membranes since they had much larger pore
scaffold and RPE were treated with lipophilic fluorescence sizes. Especially, for the blank S50, the coefficient was
dye and observed under CLSM. Stacks of images were close to infinity since both smaller probe molecules
processed into 3D images, as shown in Figure 6D. The (40 kDa) and larger probe molecules (500 kDa) could
images showed that the RPE could form a monolayer on permeate through the upper well to the bottom well
the S20 scaffold. No collapse or cell nuclei were sinking immediately (Figure S2C and D). Blank S20 also had
into the pore, which could be explained by the presence high permeability coefficients, which were around 17.14
of tight junctions in maintaining cell-cell contact and the ± 0.34 × 10 cm s for smaller molecules and 19.36 ± 0.94
/
−6
9 International Journal of Bioprinting (2022)–Volume 8, Issue 3