
Page 107 - IJB-8-4
P. 107
Köpf, et al.
A B
C
D E
F G
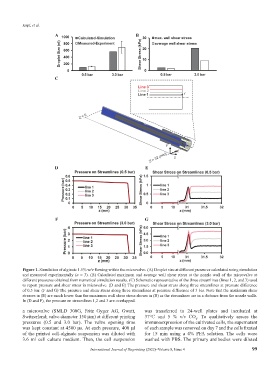
Figure 1. Simulation of alginate 1.5% w/v flowing within the microvalve. (A) Droplet size at different pressures calculated using simulation
and measured experimentally (n = 3). (B) Calculated maximum and average wall shear stress at the nozzle wall of the microvalve at
different pressures obtained from numerical simulation results. (C) Schematic representative of the three streamlines (lines 1, 2, and 3) used
to report pressure and shear stress in microvalve. (D and E) The pressure and shear stress along three streamlines at pressure difference
of 0.5 bar. (F and G) The pressure and shear stress along three streamlines at pressure difference of 3 bar. Note that the maximum shear
stresses in (E) are much lower than the maximum wall shear stress shown in (B) as the streamlines are in a distance from the nozzle walls.
In (D and F), the pressure on streamlines 1,2 and 3 are overlapped.
a microvalve (SMLD 300G, Fritz Gyger AG, Gwatt, was transferred to 24-well plates and incubated at
Switzerland; valve diameter 150 µm) at different printing 37°C und 5 % v/v CO . To qualitatively assess the
2
pressures (0.5 and 3.0 bar). The valve opening time immunoexpression of the cultivated cells, the supernatant
was kept constant at 4500 µs. At each pressure, 400 µl of each sample was removed on day 7 and the cells fixated
of the printed cell-alginate suspension was diluted with for 15 min using a 4% PFA solution. The cells were
3.6 ml cell culture medium. Then, the cell suspension washed with PBS. The primary antibodies were diluted
International Journal of Bioprinting (2022)–Volume 8, Issue 4 99