
Page 109 - IJB-8-4
P. 109
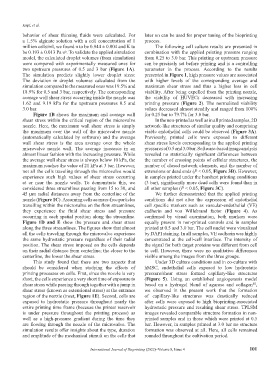
Köpf, et al.
           behavior  of  shear  thinning  fluids  were  calculated.  For   later on can be used for proper tuning of the bioprinting
           a 1.5% alginate solution with a cell concentration of 1   process.
           million cells/ml, we found n to be 0.944 ± 0.004 and K to   The following cell culture results are presented in
           be 0.193 ± 0.013 Pa·s . To validate the applied simulation   combination with the applied printing pressure ranging
                             n
           model, the calculated droplet volumes (from simulation)   from 0.25 to 3.0 bar. This printing or upstream pressure
           were compared with experimentally measured ones for   can be precisely set before printing and is a controlling
           two  upstream  pressures  of  0.5  and  3  bar  (Figure  1A).   parameter  in  the  process.  According  to  the  results
           The  simulation  predicts  slightly  lower  droplet  sizes:   presented in Figure 1, high pressure values are associated
           The  deviation  in  droplet  volumes  calculated  from  the   with  higher  levels  of  the  corresponding  average  and
           simulation compared to the measured ones was 19.5% and   maximum  shear  stress  and  thus  a  higher  loss  in  cell
           18.9% for 0.5 and 3 bar, respectively. The corresponding   viability. After being expelled from the printing nozzle,
           average wall shear stress occurring inside the nozzle was   the  viability  of  HUVECs  decreased  with  increasing
           1.62  and  9.19  kPa  for  the  upstream  pressures  0.5  and   printing  pressure  (Figure  2).  The  normalized  viability
           3.0 bar.                                            values decreased almost steadily and ranged from 100%
               Figure 1B shows the maximum and average wall    for 0.25 bar to 79.7% for 3.0 bar.
           shear stress within the critical region of the microvalve   In the non-printed as well as in all printed samples, 2D
           nozzle. Here, the maximum wall shear stress is simply   network-like structures of similar quality and comprising
           the  maximum  over  the  wall  of  the  microvalve  nozzle   viable endothelial cells could be observed (Figure 3A).
           (automatically  calculated  by  software)  and  the  average   Previously,  printed  cells  were  exposed  to  different
           wall  shear  stress  is  the  area  average  over  the  whole   shear stress levels corresponding to the applied printing
           microvalve  nozzle  wall.  The  average  increases  in  an   pressures of 0.5 and 3.0 bar. Software-based image analysis
           almost linear fashion with the increasing pressure. While   revealed no  statistically significant differences between
           the average wall shear stress is always below 10 kPa, the   the number of crossing points of cellular structures, the
           maximum reaches the value of 21 kPa at 3 bar. However,   number of closed network elements, and the number of
           not all the cells traveling through the microvalve would   extensions or dead ends (P < 0.05, Figure 3B). However,
           experience  such  high  values  of  shear  stress  occurring   in samples printed under the harshest printing conditions
           at  or  near  the  nozzle  walls.  To  demonstrate  this,  we   (3 bar), significantly more dead cells were found than in
           considered three streamlines passing from 15 to 30, and   all other samples (P < 0.05, Figure 3C).
           45 µm radial distances away from the centerline of the   We  further  demonstrated  that  the  applied  printing
           nozzle (Figure 1C). Assuming cells as mass-free particles   conditions  did  not  alter  the  expression  of  endothelial
           travelling within the microvalve on the flow streamlines,   cell specific markers such as vascular-endothelial (VE)
           they  experience  the  fluid  shear  stress  and  pressure   cadherin  and  von  Willebrand  factor  (Figure  4).  As
           occurring in each spatial position along the streamline.   confirmed  by  visual  examination,  both  markers  were
           Figure  1D and  E  show  the  pressure  and  shear  stress   equally  present  in  non-printed  controls  and  in  samples
           along the three streamlines. The figures show that almost   printed at 0.5 and 3.0 bar. The cell nuclei were visualized
           all the cells traveling through the microvalve experience   by DAPI staining. In all samples, VE cadherin was highly
           the same hydrostatic pressure regardless of their radial   concentrated  at  the  cell-cell  interface.  The  intensity  of
           position. The shear stress imposed on the cells depends   the signal for both target proteins was different from cell
           on their radial distance from centerline; the closer to the   to  cell.  However,  there  were  no  qualitative  differences
           centerline, the lower the shear stress.             visible among the images from the three groups.
               This  study  found  that  there  are  two  aspects  that   Under 3D culture conditions and in co-culture with
           should  be  considered  when  studying  the  effects  of   hMSC,  endothelial  cells  exposed  to  low  hydrostatic
           printing processes on cells. First, since the nozzle is very   pressure/shear  stress  formed  capillary-like  structures
           short, the cells experience a very short time of exposure to   (Figure  5).  Using  an  established  angiogenesis  model
           shear stress while passing through together with a jump in   based  on  a  hydrogel  blend  of  agarose  and  collagen ,
                                                                                                            [6]
           shear stress (known as extensional stress) at the entrance   we  observed  in  the  present  work  that  the  formation
           region of the nozzle (inset, Figure 1E). Second, cells are   of  capillary-like  structures  was  drastically  reduced
           exposed  to  hydrostatic  pressure  throughout  nearly  the   after  cells  were  exposed  to  high  bioprinting-associated
           entire printing time frame (because the printer reservoir   hydrostatic pressure and resulting shear stress. TPLSM
           is  under  pressure  throughout  the  printing  process)  as   images revealed comparable structure formation in non-
           well  as  a  high-pressure  gradient  during  the  time  they   printed samples and in those which were printed at 0.5
           are  flowing  through  the  nozzle  of  the  microvalve. The   bar. However, in samples printed at 3.0 bar no structure
           simulation results offer insights about the type, duration   formation was observed at all. Here, all cells remained
           and amplitude of the mechanical stimuli on the cells that   rounded throughout the cultivation period.


                                       International Journal of Bioprinting (2022)–Volume 8, Issue 4       101