
Page 142 - IJB-8-4
P. 142
3D Arenas for C. elegans Behavior
the NGM to begin flowing through the nozzle. The time 2.5.1 NGM rheology
required to reach stress (t .) is the target of our analysis of Rheology experiments were performed on NGM to
eq
NGM under actuation pressure. Time t . is used to guide uncover the fastest solidification temperature using a TH
eq
the amount of time prior to the start of print extrusion DR2 Rheometer (TA Instruments, USA). The temperature
dedicated to reaching the characteristic stress (strain). dropped from 60°C to 25°C at a rate of 5°C/min. The
More details are provided in the Supplementary File.
optimal solidification temperature is determined by the
2.5. NGM material characterization maximum slope of the G’ versus T curve (Figure S6 in
Supplementary File). The slope (dG’/dT) peaks at 35.9°C
NGM 2% agar was prepared according to standard (Figure S6 in Supplementary File), indicating the fastest
methods [6,56] . The density of liquid NGM was solidification temperature.
experimentally evaluated to be ~1.024 g/mL (~10 mL of
NGM weight ~10.24 g and the density of deionized water 2.5.2. NGM compressive viscoelastic response
was considered 1.0 g/mL). The melting point of agarose NGM presents a viscoelastic response to compressive
(molecular biology grade, Sigma-Aldrich, USA) is ≤65°C stress. Compressive stress tests were run on NGM at
and the transition temperature (gel point) is 36 ± 1.5°C 65°C in a 9.11 mm ID (inner diameter) and a 12 mm ID
(for 1.5% gel), according to the manufacturer. A 100 µL
of blue food color (AmeriColor, CA, USA) were added glass syringe. Time t . is required to reach the inflection
eq
point of the extrusion equilibrium stress (σ .) under
to 100 mL of NGM (0.1%) for in situ visibility and actuation pressure, and time t is required to relax from
eq
observational purposes. r
it. The inflection point occurs at a stress value σ , which
eq.
varies with strain rate ε. The time t . required to reach it
A B varies depending on syringe ID. eq
Details on NGM viscoelastic response
characterization are provided in the Supplementary File.
2.6. C. elegans behavioral experiments
Snapshots of C. elegans actions during behavioral
experiments were taken with a DP22 camera, mounted on
a SZ61 dissection microscope, using CellSens Software
C (all by Olympus, Japan).
2.6.1. Barrier crossing
In the control experiment, where C. elegans were allowed
to reach a food source not framed by a physical barrier, a
droplet of OP50 was placed on a regular NGM plate and
was framed by a figurative square, drawn with a marker
on the bottom of the plate. Nematodes were placed
around the targeted area (Figure 5) and were allowed to
roam free.
In all experiments where Parnon-printed squares
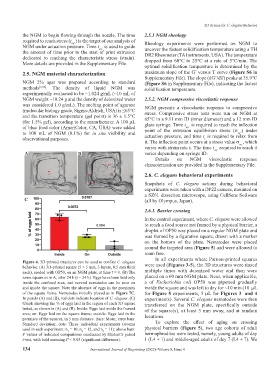
Figure 4. 3D-printed structures can be used to confine C. elegans
behavior. (A) 3D-printed square (5 × 5 mm, 3 layers, 0.5 mm thick were used (Figures 3-5), the 3D structures were rinsed
each), seeded with OP50, on an NGM plate, at time t = 0. (B) The multiple times with deionized water and then were
same square as in A, after 24 h (t = 24 h). Eggs have been laid only placed on a 60 mm NGM plate. Next, when applicable,
inside the confined area, and several nematodes can be seen on a of Escherichia coli OP50 was pipetted gradually
and inside the square. Note the absence of eggs in the proximity inside the square and was left to dry for ~10 min (10 µL
of the square frame. Nematodes initially placed as in Figure 7C. for Figure 5 experiments, 5 µL for Figures 3 and 4
In panels (A) and (B), red dots indicate location of C. elegans. (C) experiments). Several C. elegans nematodes were then
Graph showing the % of eggs laid in the region of each 3D square transferred on the NGM plate, specifically outside
tested, as shown in (A) and (B). Inside: Eggs laid inside the framed of the square(s), at least 3 mm away, and at random
area; on: Eggs laid on the square frame; outside: Eggs laid in the
premises of the squares, in 5 mm distance. Bars: Mean; error bars: locations.
Standard deviation; dots: Three individual experiments (worms To explore the effect of aging on crossing
used in each experiment: n = 10, n = 12, and n = 11); above bars: physical barriers (Figure 5), two age cohorts of adult
1
3
2
P values of indicated comparisons conducted by Student’s paired hermaphrodites were tested, namely, young adults of day
t-test, with bold meaning P < 0.05 (significant difference). 1 (L4 + 1) and middle-aged adults of day 7 (L4 + 7). We
134 International Journal of Bioprinting (2022)–Volume 8, Issue 4