
Page 141 - IJB-8-4
P. 141
Cardoza, et al.
A B
C
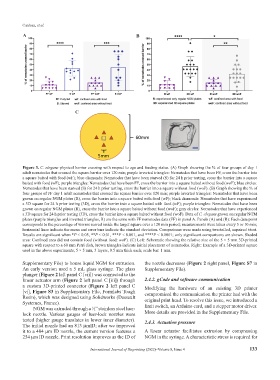
Figure 3. C. elegans physical barrier crossing with respect to age and feeding status. (A) Graph showing the % of four groups of day 1
adult nematodes that crossed the square barrier over 120 min; purple inverted triangles: Nematodes that have been FF, cross the barrier into
a square baited with food (wF); blue diamonds: Nematodes that have been starved (S) for 24 h prior testing, cross the barrier into a square
baited with food (wF); purple triangles: Nematodes that have been FF, cross the barrier into a square baited without food (woF); blue circles:
Nematodes that have been starved (S) for 24 h prior testing, cross the barrier into a square without food (woF). (B) Graph showing the % of
four groups of FF day 1 adult nematodes that crossed the square barrier over 120 min; purple inverted triangles: Nematodes that have been
grown on regular NGM plates (R), cross the barrier into a square baited with food (wF); black diamonds: Nematodes that have experienced
a 3D square for 24 h prior testing (3D), cross the barrier into a square baited with food (wF); purple triangles: Nematodes that have been
grown on regular NGM plates (R), cross the barrier into a square baited without food (woF); gray circles: Nematodes that have experienced
a 3D square for 24 h prior testing (3D), cross the barrier into a square baited without food (woF). Data of C. elegans grown on regular NGM
plates (purple triangles and inverted triangles, R) are the same with FF nematodes data (FF) in panel A. Panels (A) and (B): Each data point
corresponds to the percentage of worms scored inside the target square over a 120 min period; measurements were taken every 5 or 10 min;
horizontal lines indicate the mean and error bars indicate the standard deviation. Comparisons were made using two-tailed, unpaired t-test.
Results are significant when *P < 0.05, **P < 0.01, ***P < 0.001, and ****P < 0.0001; only significant comparisons are shown. Shaded
area: Confined area did not contain food (without food: woF). (C) Left: Schematic showing the relative size of the 5 × 5 mm 3D-printed
square with respect to a 60 mm Petri dish, brown triangles indicate initial placement of nematodes. Right: Example of a 3D-printed square
used in the above experiments, 5 × 5 mm, 3 layers, 0.5 mm thick each; scale bar: 1 mm.
Supplementary File) to house liquid NGM for extrusion. the nozzle decreases (Figure 2 right panel, Figure S7 in
An early version used a 5 mL glass syringe. The glass Supplementary File).
plunger (Figure 2 left panel C [vii]) was connected to the
linear actuator arm (Figure 2 left panel C [iii]) through 2.4.2. gCode and software communication
a custom 3D-printed connector (Figure 2 left panel C Modifying the hardware of an existing 3D printer
[vi], Figure S3 in Supplementary File, Formlabs Tough compromised the communication the printer had with the
Resin), which was designed using Solidworks (Dassault original print head. To resolve this issue, we introduced a
Systemes, France).
NGM was extruded through a ½” stainless steel luer- limit switch, an Arduino card, and a stepper motor driver.
lock nozzle. Various gauges of luer-lock nozzles were More details are provided in the Supplementary File.
tested (higher gauge translates in lower inner diameter). 2.4.3. Actuation pressure
The initial nozzle had an 813 µmID; after we improved
it to a 404 µm ID nozzle, the current version features a A linear actuator facilitates extrusion by compressing
254 µm ID nozzle. Print resolution improves as the ID of NGM in the syringe. A characteristic stress is required for
International Journal of Bioprinting (2022)–Volume 8, Issue 4 133