
Page 96 - IJB-8-4
P. 96
3D Bioprinting of Human Neural Tissues
A B C
D E F
G H I
J K L
M N
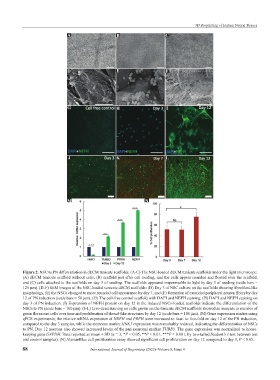
Figure 2. NSC to PN differentiation in dECM tunicate scaffolds. (A-C) The NSC-loaded dECM tunicate scaffolds under the light microscope:
(A) dECM tunicate scaffold without cells, (B) scaffold just after cell loading, and the cells appear rounded and floated over the scaffold,
and (C) cells attached to the scaffolds on day 3 of seeding. The scaffolds appeared impermeable to light by day 3 of seeding (scale bars =
125 µm). (D-F) SEM images of the NSC-loaded tunicate dECM scaffolds: (D) Day 3 of NSC culture on the scaffolds showing fibroblast-like
morphology, (E) the NSCs changed to more rounded cell appearance by day 7, and (F) formation of extended peripheral neuron fibers by day
12 of PN induction (scale bars = 50 µm). (G) The cell-free control scaffold with DAPI and NEFH staining. (H) DAPI and NEFH staining on
day 3 of PN induction. (I) Expression of NEFH protein on day 12 in the induced NSCs-loaded scaffolds indicate the differentiation of the
NSCs to PN (scale bars = 100 µm). (J-L) Live-dead staining on cells grown on the tunicate dECM scaffolds showed an increase in number of
green florescent cells over time and proliferation of thread-like structures by day 12 (scale bars = 100 µm). (M) Gene expression studies using
qPCR experiments; the relative mRNA expression of NEFH and PRPH were increased to four- to five-fold on day 12 of the PN induction,
compared to the day 3 samples, while the stemness marker HNK1 expression was remarkably reduced, indicating the differentiation of NSCs
to PN. Day 12 neurons also showed increased levels of the pan neuronal marker TUBB3. The gene expression was normalized to house-
keeping gene GAPDH. Data reported as mean ± SD (n = 3; *P < 0.05, **P < 0.01, ***P < 0.001, by two-tailed Student’s t-test between test
and control samples). (N) AlamarBlue cell proliferation assay showed significant cell proliferation on day 12 compared to day 3, P < 0.05.
88 International Journal of Bioprinting (2022)–Volume 8, Issue 4