
Page 211 - IJB-9-1
P. 211
International Journal of Bioprinting FeS /PCL scaffold for bone regeneration
2
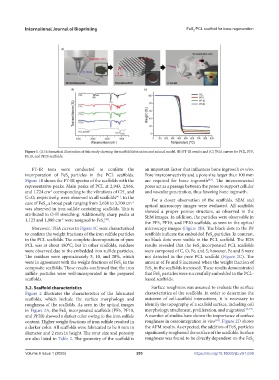
Figure 1. (A) Schematical illustration of this study showing the scaffold fabrication and animal model. (B) FT-IR results and (C) TGA curves for PCL, PF5,
PF10, and PF20 scaffolds.
FT-IR tests were conducted to confirm the an important factor that influences bone ingrowth in vivo.
incorporation of FeS particles in the PCL scaffolds. Pore interconnectivity and a pore size larger than 100 mm
2
Figure 1B shows the FT-IR spectra of the scaffolds with the are required for bone ingrowth . The interconnected
[43]
representative peaks. Main peaks of PCL at 2,943, 2,866, pores act as a passage between the pores to support cellular
and 1,724 cm corresponding to the vibrations of CH and and vascular penetration, thus favoring bone ingrowth.
-1
2
C=O, respectively, were observed in all scaffolds . In the For a closer observation of the scaffolds, SEM and
[41]
case of FeS ,a broad peak ranging from 2,630 to 3,700 cm optical microscopy images were evaluated. All scaffolds
-1
2
was observed in iron sulfide containing scaffolds. This is showed a proper porous structure, as observed in the
attributed to O-H stretching. Additionally, sharp peaks at SEM images. In addition, the particles were observable in
1,123 and 1,080 cm were assigned to FeS 2 [42] . the PF5, PF10, and PF20 scaffolds, as seen in the optical
-1
Moreover, TGA curves in Figure 1C were characterized microscopy images (Figure 2B). The black dots in the PF
to confirm the weight fractions of the iron sulfide particles scaffolds indicate the embedded FeS particles. In contrast,
2
in the PCL scaffolds. The complete decomposition of pure no black dots were visible in the PCL scaffold. The EDS
PCL was at about 480°C, but in other scaffolds, residues results revealed that the FeS incorporated PCL scaffolds
2
were observed due to the embedded iron sulfide particles. were composed of C, O, Fe, and S; however, Fe and S were
The residues were approximately 5, 10, and 20%, which not detected in the pure PCL scaffold (Figure 2C). The
were in agreement with the weight fractions of FeS in the amount of Fe and S increased when the weight fraction of
2
composite scaffolds. These results confirmed that the iron FeS in the scaffolds increased. These results demonstrated
2
sulfide particles were well-incorporated in the prepared that FeS particles were successfully embedded in the PCL-
2
scaffolds. based scaffolds.
3.2. Scaffold characteristics Surface roughness was assessed to evaluate the surface
Figure 2 illustrates the characteristics of the fabricated characteristics of the scaffolds. In order to determine the
scaffolds, which include the surface morphology and outcome of cell-scaffold interactions, it is necessary to
roughness of the scaffolds. As seen in the optical images identify the topography of a scaffold surface, including cell
in Figure 2A, the FeS incorporated scaffolds (PF5, PF10, morphology, attachment, proliferation, and migration [44-47] .
2
and PF20) showed a darker color owing to the iron sulfide A number of studies have shown the importance of surface
content. Higher weight fractions of iron sulfide resulted in roughness in osseointegration in vivo . Figure 2D shows
[48]
a darker color. All scaffolds were fabricated to be 8 mm in the AFM results. As expected, the addition of FeS particles
2
diameter and 2 mm in height. The strut size and porosity significantly roughened the surface of the scaffolds. Surface
are also listed in Table 2. The geometry of the scaffold is roughness was found to be directly dependent on the FeS
2
Volume 9 Issue 1 (2023)olume 9 Issue 1 (2023) 203 https://doi.org/10.18063/ijb.v9i1.636
V