
Page 216 - IJB-9-1
P. 216
International Journal of Bioprinting FeS /PCL scaffold for bone regeneration
2
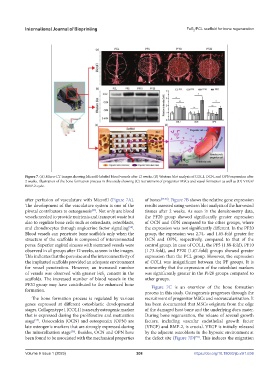
Figure 7. (A) Micro-CT images showing Microfil-labeled blood vessels after 12 weeks. (B) Western blot analysis of COL1, OCN, and OPN expression after
2 weeks. Illustration of the bone formation process in this study showing (C) recruitment of progenitor MSCs and vessel formation as well as (D) VEGF/
BMP-2 cycle.
after perfusion of vasculature with Microfil (Figure 7A). of bones [57,58] . Figure 7B shows the relative gene expression
The development of the vasculature system is one of the results assessed using western blot analysis of the harvested
pivotal contributors to osteogenesis . Not only are blood tissues after 2 weeks. As seen in the densitometry data,
[53]
vessels needed to provide nutrients and transport waste but the PF20 group showed significantly greater expression
also to regulate bone cells such as osteoclasts, osteoblasts, of OCN and OPN compared to the other groups, where
and chondrocytes through angiocrine factor signaling . the expression was not significantly different. In the PF20
[54]
Blood vessels can penetrate bone scaffolds only when the group, the expression was 2.74- and 1.65-fold greater for
structure of the scaffolds is composed of interconnected OCN and OPN, respectively, compared to that of the
pores. Superior sagittal sinuses with stemmed vessels were control group. In case of COL1, the PF5 (1.88-fold), PF10
observed in all groups after 12 weeks, as seen in the images. (1.73-fold), and PF20 (1.67-fold) groups showed greater
This indicates that the pore size and the interconnectivity of expression than the PCL group. However, the expression
the implanted scaffolds provided an adequate environment of COL1 was insignificant between the PF groups. It is
for vessel penetration. However, an increased number noteworthy that the expression of the osteoblast markers
of vessels was observed with greater FeS content in the was significantly greater in the PF20 groups compared to
2
scaffolds. The increased number of blood vessels in the other groups.
PF20 group may have contributed to the enhanced bone Figure 7C is an overview of the bone formation
formation.
process in this study. Osteogenesis progresses through the
The bone formation process is regulated by various recruitment of progenitor MSCs and neovascularization. It
genes expressed at different osteoblastic developmental has been documented that MSCs originate from the edge
stages. Collagen type 1 (COL1) is an early osteogenic marker of the damaged host bone and the underlying dura mater.
that is expressed during the proliferative and maturation During bone regeneration, the release of several growth
[55]
stage . Osteocalcin (OCN) and osteopontin (OPN) are factors, including vascular endothelial growth factor
late osteogenic markers that are strongly expressed during (VEGF) and BMP-2, is crucial. VEGF is initially released
the mineralization stage . Besides, OCN and OPN have by the adjacent osteoblasts in the hypoxic environment at
[56]
been found to be associated with the mechanical properties the defect site (Figure 7D) . This induces the migration
[59]
Volume 9 Issue 1 (2023)olume 9 Issue 1 (2023)
V 208 https://doi.org/10.18063/ijb.v9i1.636