
Page 213 - IJB-9-1
P. 213
International Journal of Bioprinting FeS /PCL scaffold for bone regeneration
2
Figure 3. Mechanical properties of the scaffolds, including (A) stress–strain curve and (B) compressive modulus. (C) Schematic showing the interaction
during compressive stress.
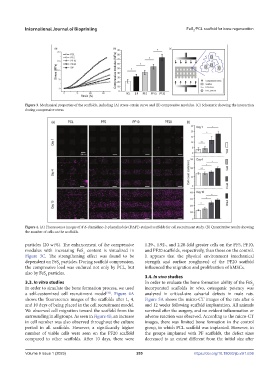
Figure 4. (A) Fluorescence images of 4′,6-diamidino-2-phenylindole (DAPI)-stained scaffolds for cell recruitment study. (B) Quantitative results showing
the number of cells on the scaffolds.
particles (20 wt%). The enhancement of the compressive 1.29-, 1.92-, and 2.20-fold greater cells on the PF5, PF10,
modulus with increasing FeS content is visualized in and PF20 scaffolds, respectively, than those on the control.
2
Figure 3C. The strengthening effect was found to be It appears that the physical environment (mechanical
dependent on FeS particles. During scaffold compression, strength and surface roughness) of the PF20 scaffold
2
the compressive load was endured not only by PCL, but influenced the migration and proliferation of hMSCs.
also by FeS particles.
2 3.4. In vivo studies
3.3. In vitro studies In order to evaluate the bone formation ability of the FeS
2
In order to simulate the bone formation process, we used incorporated scaffolds in vivo, osteogenic potency was
a self-customized cell recruitment model . Figure 4A analyzed in critical-size calvarial defects in male rats.
[32]
shows the fluorescence images of the scaffolds after 1, 4, Figure 5A shows the micro-CT images of the rats after 6
and 10 days of being placed in the cell recruitment model. and 12 weeks following scaffold implantation. All animals
We observed cell migration toward the scaffold from the survived after the surgery, and no evident inflammation or
surrounding in all groups. As seen in Figure 4B, an increase adverse reaction was observed. According to the micro-CT
in cell number was also observed throughout the culture images, there was limited bone formation in the control
period in all scaffolds. However, a significantly higher group, in which PCL scaffold was implanted. However, in
number of viable cells were seen on the PF20 scaffold the groups implanted with PF scaffolds, the defect sizes
compared to other scaffolds. After 10 days, there were decreased to an extent different from the initial size after
Volume 9 Issue 1 (2023)olume 9 Issue 1 (2023)
V 205 https://doi.org/10.18063/ijb.v9i1.636