
Page 63 - IJB-9-1
P. 63
International Journal of Bioprinting In situ defect detection and feedback control with P-OCT
2.4.3. Defects around the turnarounds and feedback in ROI3, ROI4, ROI5, and ROI6 represented the adjusted
mech nodes added at 0.5 mm, 1 mm, 1.5 mm, and 2 mm in front
In addition to the straight path and end points (or behind) of the corner node, respectively. At the same
mentioned above, material deposition errors often occur time, the speed of yellow path was increased from 11 mm/s
at turnarounds. There is a velocity change around the to 12 mm/s. The analysis of FS and LT values in four areas
turnarounds, which leads to material deposition errors ROI3-6 is shown in Figure 6F, and the average FS values in
when the velocity does not match the pressure and ROI1-6 were 0.531 ± 0.073 mm, 0.483 ± 0.021 mm, 0.475
rheological properties of the material. Armstrong et al. ± 0.022 mm, 0.471 ± 0.028 mm, 0.443 ± 0.036 mm, and
corrected the path error using reverse compensation [18] . 0.430 ± 0.040 mm, respectively. The average LT values in
This section mainly focuses on compensating for FS ROI1-6 were 0.378 ± 0.052 mm, 0.333 ± 0.021 mm, 0.333
and LT defects around the turnarounds with feedback ± 0.050 mm, 0.313 ± 0.056 mm, 0.298 ± 0.0489 mm, and
control for the common right-angle corner path 0.288 ± 0.035mm, respectively. The result indicated that
(Figure 6A). In 3D bioprinting, GCode nodes are FS and LT defects in the turnarounds after compensation
typically set at the corners in the path (see asterisk). Due (ROI3-6) were smaller than that before compensation
to the acceleration and deceleration zones before and (ROI1). Among them, FS and LT results in ROI3 were
after the node, a lower average velocity typically leads to closest to the target FS and LT (ROI2) in the straight path.
excessive material deposition, and FS and LT defects. To With the pre-experiment, the target FS (0.480 mm) and LT
compensate for the FS and LT defects at the turnarounds, (0.330 mm) for the target material (HA) can be obtained
the node position and velocity were adjusted during the at the turnarounds under the compensation condition of
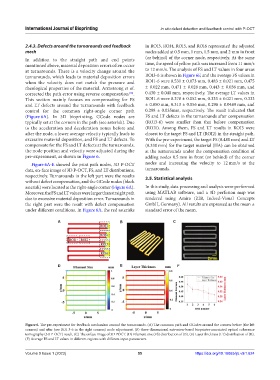
pre-experiment, as shown in Figure 6. adding nodes 0.5 mm in front (or behind) of the corner
Figure 6A-E showed the print path nodes, 3D P-OCT nodes and increasing the velocity to 12 mm/s at the
data, en-face image of 3D P-OCT, FS, and LT distributions, turnarounds.
respectively. Turnarounds in the left part were the results 2.5. Statistical analysis
without defect compensation, and the GCode nodes (black
asterisk) were located at the right-angle corner (Figure 6A). In this study, data processing and analysis were performed
Moreover, the FS and LT values were larger than straight path using MATLAB software, and a 3D perfusion map was
due to excessive material deposition error. Turnarounds in rendered using Amira (ZIB, Indeed-Visual Concepts
the right part were the result with defect compensation GmbH, Germany). All results are expressed as the mean ±
under different conditions. In Figure 6A, the red asterisks standard error of the mean.
A B C
D E F
Figure 6. The pre-experiment for feedback mechanism around the turnarounds. (A) The common path and GCodes around the corners before (the left
corners) and after (see ROI 3-6 in the right corners) node adjustment. (B) three-dimensional extrusion-based bioprinter-associated optical coherence
tomography (3D P-OCT) result. (C) The enface image of 3D POCT. (D) Filament size (FS) distribution of (B). (E) Layer thickness (LT) distribution of (B).
(F) Average FS and LT values in different regions with different input parameters.
Volume 9 Issue 1 (2023) 55 https://doi.org/10.18063/ijb.v9i1.624