
Page 65 - IJB-9-1
P. 65
International Journal of Bioprinting In situ defect detection and feedback control with P-OCT
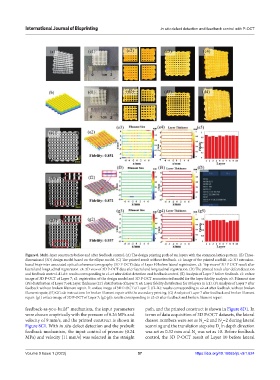
Figure 8. Multi-layer constructs before and after feedback control. (A) The design printing path of ten layers with the common lattice pattern. (B) Three-
dimensional (3D) design model based on the ellipse model. (C) The printed result without feedback. c1: Image of the printed scaffold; c2: 3D extrusion-
based bioprinter-associated optical coherence tomography (3D P-OCT) data of Layer 10 before lateral registration. c3: Top view of 3D P-OCT result after
lateral and longitudinal registration. c4: 3D view of 3D P-OCT data after lateral and longitudinal registration. (D) The printed result after defect detection
and feedback control. d1-d4: results corresponding to c1-c4 after defect detection and feedback control. (E) Analysis of Layer 7 before feedback. e1: enface
image of 3D P-OCT of Layer 7; e2: registration of the design model and 3D P-OCT reconstructed model for the layer fidelity analysis. e3: Filament size
(FS) distribution of Layer 7; e4: Layer thickness (LT) distribution of Layer 7; e5: Layer fidelity distribution for 10 layers in (c1). (F) Analysis of Layer 7 after
feedback without broken filament repair. f1: enface image of 3D P-OCT of Layer 7. (f2-f4): results corresponding to e2-e4 after feedback without broken
filament repair; (f5) GCode instructions for broken filament repair with the secondary printing. (G) Analysis of Layer 7 after feedback and broken filament
repair. (g1) enface image of 3D P-OCT of Layer 7; (g2-g5): results corresponding to e2-e5 after feedback and broken filament repair.
feedback-as-you-build” mechanism, the input parameters path, and the printed construct is shown in Figure 8D1. In
were chosen empirically with the pressure of 0.26 MPa and terms of data acquisition of 3D P-OCT datasets, the lateral
velocity of 9 mm/s, and the printed construct is shown in dataset numbers were set as N =2 and N =2 during lateral
x
y
Figure 8C1. With in situ defect detection and the prebuilt scanning and the translation step size D in depth direction
z
feedback mechanism, the input control of pressure (0.24 was set as 0.32 mm and N was set as 10. Before feedback
z
MPa) and velocity (11 mm/s) was selected in the straight control, the 3D P-OCT result of Layer 10 before lateral
Volume 9 Issue 1 (2023) 57 https://doi.org/10.18063/ijb.v9i1.624