
Page 64 - IJB-9-1
P. 64
International Journal of Bioprinting In situ defect detection and feedback control with P-OCT
A B C
D E F
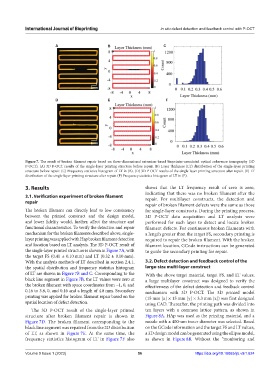
Figure 7. The result of broken filament repair based on three-dimensional extrusion-based bioprinter-associated optical coherence tomography (3D
P-OCT). (A) 3D P-OCT results of the single-layer printing structure before repair. (B) Layer thickness (LT) distribution of the single-layer printing
structure before repair. (C) Frequency statistics histogram of LT in (B). (D) 3D P-OCT results of the single-layer printing structure after repair. (E) LT
distribution of the single-layer printing structure after repair. (F) Frequency statistics histogram of LT in (E).
3. Results shows that the LT frequency result of zero is zero,
indicating that there was no broken filament after the
3.1. Verification experiment of broken filament repair. For multilayer constructs, the detection and
repair
repair of broken filament defects were the same as those
The broken filament can directly lead to low consistency for single-layer constructs. During the printing process,
between the printed construct and the design model, 3D P-OCT data acquisition and LT analysis were
and lower fidelity would, further, affect the structure and performed for each layer to detect and locate broken
functional characteristics. To verify the detection and repair filament defects. For continuous broken filaments with
mechanism for the broken filaments described above, single- a length greater than the target FS, secondary printing is
layer printing was applied with Hap broken filament detection required to repair the broken filament. With the broken
and location based on LT analysis. The 3D P-OCT result of filament location, GCode instructions can be generated
the single-layer printed structure is shown in Figure 7A, with to guide the secondary printing for repair.
the target FS (0.41 ± 0.10 mm) and LT (0.32 ± 0.10 mm).
With the analysis methods of LT described in section 2.4.1, 3.2. Defect detection and feedback control of the
the spatial distribution and frequency statistics histogram large-size multi-layer construct
of LT are shown in Figure 7B and C. Corresponding to the With the above target material, target FS, and LT values,
black line segment in Figure 7B, the LT values were zero at a large multilayer construct was designed to verify the
the broken filament with space coordinates from −1, 0, and effectiveness of the defect detection and feedback control
0.16 to 3.8, 0, and 0.16 and a length of 4.8 mm. Secondary mechanism with 3D P-OCT. The 3D printed model
printing was applied for broken filament repair based on the (15 mm [x] × 15 mm [y] × 3.3 mm [z]) was first designed
spatial location of defect detection. using CAD. Thereafter, the printing path was divided into
The 3D P-OCT result of the single-layer printed ten layers with a common lattice pattern, as shown in
structure after broken filament repair is shown in Figure 8A. HAp was used as the printing material, and a
Figure 7D. The broken filament corresponding to the nozzle with a 400-um inner diameter was selected. Based
black line segment was repaired from the 2D distribution on the GCode information and the target FS and LT values,
of LT, as shown in Figure 7E. At the same time, the a 3D design model can be generated using the ellipse model,
frequency statistics histogram of LT in Figure 7F also as shown in Figure 8B. Without the “monitoring and
Volume 9 Issue 1 (2023) 56 https://doi.org/10.18063/ijb.v9i1.624