
Page 59 - IJB-9-1
P. 59
International Journal of Bioprinting In situ defect detection and feedback control with P-OCT
A B C of FS and LT can be equivalent to the size of the major and
the minor axes of the ellipse. After interpolation, the points
PT GCode of GCode nodes were transformed into an elliptic
upper surface, and the surface points PT S_GCode (see the green
points) were compared with the material surface points
PT S_P-OCT (see the purple points) generated from 3D P-OCT
data, as shown in Figure 2C. After registration, the material
D E points PT and GCode nodes PT were projected
GCode
S_P-OCT
onto the XY plane. For each GCode node in the XY plane
PT xy_GCode (i), the nearest point in the material points PT xy_S_P-
(i) was determined, and the nearest distance between
OCT
the nearest point pair was recorded as follow:
Dis () = PT i () − PT i () (1)
i
xy
xy SP OCT−_ _
xy GCode_
° 2
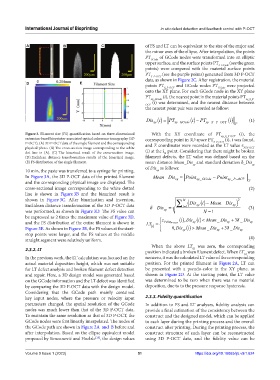
Figure 3. Filament size (FS) quantification based on three-dimensional With the XY coordinate of PT xy_S_P-OCT (i), the
extrusion-based bioprinter-associated optical coherence tomography (3D corresponding point in 3D space PT (i), t was found,
S_P-OCT
P-OCT). (A) 3D P-OCT data of the single filament and the corresponding and Z coordinates were recorded as the LT value z
physical photo. (B) The cross-section image corresponding to the white PTP-OCT
dot line in (A). (C) The binarized result of the cross-section image. (i) at the i point. Considering that there might be broken
th
(D) Euclidean distance transformation results of the binarized image. filament defects, the LT value was defined based on the
(E) FS distribution of the single filament. mean distance Mean_Dis and standard deviation δ_Dis
xy
xy
of Dis as follows:
10 min, the paste was transferred to a syringe for printing. xy
In Figure 3A, the 3D P-OCT data of the printed filament Mean Dis_ xy = Point xy GCode_ − Point xy POCT_ −
and the corresponding physical image are displayed. The ' 2
cross-sectional image corresponding to the white dotted (2)
line is shown in Figure 3B and the binarized result is
shown in Figure 3C. After binarization and inversion, ∑ N ( _ Dis ) 2
i
xy
Euclidean distance transformation of the 3D P-OCT data _ Dis = i=1 Dis () − Mean xy (3)
was performed, as shown in Figure 3D. The FS value can xy N −1
be expressed as 2 times the maximum value of Figure 3D, ()
and the FS distribution of the entire filament is shown in LT = z Point POCT− i Dis () <, xy i Mean Dis +_ xy 3 _ Dis xy
i ()
i))
Figure 3E. As shown in Figure 3E, the FS values at the start- , 0 Dis ( > Mean Dis xy + 3 _ Dis xy
_
xy
stop points were larger, and the FS values at the middle
straight segment were relatively uniform. (4)
When the above LT was zero, the corresponding
(i)
2.3.2. LT position indicated a broken filament defect. When LT was
(i)
In the previous work, the LT calculation was focused on the nonzero, it was the calculated LT value of the corresponding
actual material deposition height, which was not suitable position. For the printed filament in Figure 2A, LT can
for LT defect analysis and broken filament defect detection be presented with a pseudo-color in the XY plane, as
and repair. Here, a 3D design model was generated based shown in Figure 2D. At the starting point, the LT value
on the GCode information and the LT defect was identified was determined to be zero when there was no material
by comparing the 3D P-OCT data with the design model. deposition, due to to the pressure response hysteresis.
Considering that the GCode path mainly contained
key input nodes, where the pressure or velocity input 2.3.3. Fidelity quantification
parameters changed, the spatial resolution of the GCode In addition to FS and LT analyses, fidelity analysis can
nodes was much lower than that of the 3D P-OCT data. provide a final estimation of the consistency between the
To maintain the same resolution as that of 3D P-OCT, the construct and the designed model, which can be applied
GCode nodes were first linearly interpolated. The nodes of to each layer during the printing process and the overall
the GCode path are shown in Figure 2A and B before and construct after printing. During the printing process, the
after interpolation. Based on the ellipse equivalent model construct structure of each layer can be reconstructed
proposed by Simeunović and Hoelzle , the design values using 3D P-OCT data, and the fidelity value can be
[13]
Volume 9 Issue 1 (2023) 51 https://doi.org/10.18063/ijb.v9i1.624