
Page 61 - IJB-9-1
P. 61
International Journal of Bioprinting In situ defect detection and feedback control with P-OCT
A B C D
E F G
H I
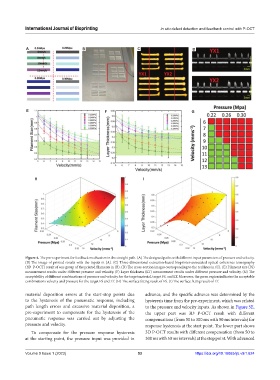
Figure 4. The pre-experiment for feedback mechanism in the straight path. (A) The designed paths with different input parameters of pressure and velocity.
(B) The image of printed results with the inputs in (A). (C) Three-dimensional extrusion-based bioprinter-associated optical coherence tomography
(3D P-OCT) result of one group of the printed filaments in (B). (D) The cross-section images corresponding to the red lines in (C). (E) Filament size (FS)
measurement results under different pressure and velocity. (F) Layer thickness (LT) measurement results under different pressure and velocity. (G) The
acceptability of different combinations of pressure and velocity for the target material, target FS, and LT. Moreover, the green region indicates the acceptable
combinations velocity and pressure for the target FS and LT. (H) The surface fitting result of FS. (I) The surface fitting result of LT.
material deposition errors at the start-stop points due advance, and the specific advance was determined by the
to the hysteresis of the pneumatic response, including hysteresis time from the pre-experiment, which was related
path length errors and excessive material deposition, a to the pressure and velocity inputs. As shown in Figure 5E,
pre-experiment to compensate for the hysteresis of the the upper part was 3D P-OCT result with different
pneumatic response was carried out by adjusting the compensations (from 50 to 300 ms with 50 ms intervals) for
pressure and velocity. response hysteresis at the start point. The lower part shows
To compensate for the pressure response hysteresis 3D P-OCT results with different compensation (from 50 to
at the starting point, the pressure input was provided in 300 ms with 50 ms intervals) at the stop point. With advanced
Volume 9 Issue 1 (2023) 53 https://doi.org/10.18063/ijb.v9i1.624