
Page 66 - IJB-9-1
P. 66
International Journal of Bioprinting In situ defect detection and feedback control with P-OCT
A D
a1 a2
B
b1 b2
C E
c1 c2
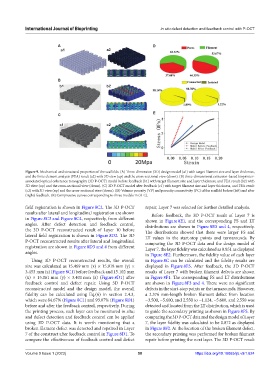
Figure 9. Mechanical and structural properties of the scaffolds. (A) Three-dimension (3D) design model (a1) with target filament size and layer thickness,
and the finite element analysis (FEA) result (a2) with 3D view (up) and the cross-sectional view (down). (B) three-dimensional extrusion-based bioprinter-
associated optical coherence tomography (3D P-OCT) model before feedback (b1) with target filament size and layer thickness, and FEA result (b2) with
3D view (up) and the cross-sectional view (down). (C) 3D P-OCT model after feedback (c1) with target filament size and layer thickness, and FEA result
(c2) with 3D view (up) and the cross-sectional view (down). (D) Volume porosity (VP) and porosity connectivity (PC) of the scaffold before (left) and after
(right) feedback. (E) Compressive curves corresponding to three models in (A-C).
field registration is shown in Figure 8C2. The 3D P-OCT repair, Layer 7 was selected for further detailed analysis.
results after lateral and longitudinal registration are shown Before feedback, the 3D P-OCT result of Layer 7 is
in Figure 8C3 and Figure 8C4, respectively, from different shown in Figure 8E1, and the corresponding FS and LT
angles. After defect detection and feedback control, distributions are shown in Figure 8E3 and 4, respectively.
the 3D P-OCT reconstructed result of Layer 10 before The distributions showed that there were larger FS and
lateral field registration is shown in Figure 8D2. The 3D LT values in the start-stop points and turnarounds. By
P-OCT reconstructed results after lateral and longitudinal comparing the 3D P-OCT data and the design model of
registration are shown in Figure 8D3 and 4 from different Layer 7, the layer fidelity was calculated as 0.851 as displayed
angles. in Figure 8E2. Furthermore, the fidelity value of each layer
Using 3D P-OCT reconstructed results, the overall in Figure 8C can be calculated and the fidelity results are
size was calculated as 15.469 mm (x) × 15.918 mm (y) × displayed in Figure 8E5. After feedback, the 3D P-OCT
3.453 mm (z) (Figure 8C1) before feedback and 15.102 mm results of Layer 7 with broken filament defects are shown
(x) × 15.061 mm (y) × 3.401 mm (z) (Figure 8D1) after in Figure 8F1. The corresponding FS and LT distributions
feedback control and defect repair. Using 3D P-OCT are shown in Figure 8F3 and 4. There were no significant
reconstructed model and the design model, the overall defects in the start-stop points or the turnarounds. However,
fidelity can be calculated using Eq.(6) in section 2.4.3, a 2.376 mm-length broken filament defect from location
which were 84.67% (Figure 8C1) and 93.07% (Figure 8D1) −3.500, −5.600, and 2.550 to −1.124, −5.600, and 2.550 was
before and after the feedback control, respectively. During detected and located from the LT distribution, which is used
the printing process, each layer can be monitored in situ; to guide the secondary printing as shown in Figure 8F5. By
and defect detection and feedback control can be applied comparing the 3D P-OCT data and the design model of Layer
using 3D P-OCT data. It is worth mentioning that a 7, the layer fidelity was calculated to be 0.872 as displayed
broken filament defect was detected and repaired in Layer in Figure 8F2. At the location of the broken filament defect,
7 of the construct after feedback control in Figure 8D1. To the secondary printing was performed for broken filament
compare the effectiveness of feedback control and defect repair before printing the next layer. The 3D P-OCT result
Volume 9 Issue 1 (2023) 58 https://doi.org/10.18063/ijb.v9i1.624