
Page 62 - IJB-9-1
P. 62
International Journal of Bioprinting In situ defect detection and feedback control with P-OCT
extrusion from 50 to 300 ms, no material deposition at the ∆R = c t + c tt + ct t + c t + c t + c tt
2
3
3
2
2
theoretical path starting point in Figure 5A was improved. 11 21 2 3 2 1 4 2 51 61 2
Correspondingly, the FS and LT distributions are shown + ct 2 + ct + ct + c , (8)
72
81
922
10
in Figure 5F-G. Subsequently, the hysteresis compensation
time t at the start point was determined by the deposition where c , c ,…,c are the solution coefficients of the
1
9
2
1
path error, FS, and LT errors within 1 mm of the material fitting function ∆R. The surface-fitting results are shown
starting to deposit, as shown in Figure 5F-G. In addition, in Figure 5H. Based on the above fitting results, t and t
1
2
at the end point, the early termination of extrusion might were calculated as 148 ms and 144 ms, respectively, and
be an effective solution. The time of the early termination the printed results after response hysteresis compensation
of extrusion t can, then, be determined by the deposition are displayed in Figure 5I. The designed path (red dotted
2
path error at the stop point from Figure 5F-G. Furthermore, lines) and the actual material path remained the same. The
the surface fitting functions∆R of t and t can be generated FS and LT distributions (Figure 5J-K) also indicated that
2
1
using the above data with the corresponding material and there was no significant excessive material deposition at
needle conditions, as follow: the starting and ending points (see the red arrows).
A B C D
E F G
H I J K
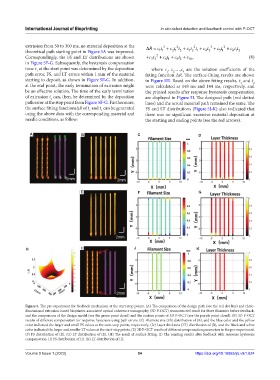
Figure 5. The pre-experiment for feedback mechanism at the start-stop points. (A) The comparison of the design path (see the red dot line) and three-
dimensional extrusion-based bioprinter-associated optical coherence tomography (3D P-OCT) reconstructed result for three filaments before feedback,
and the comparison of the design model (see the green point cloud) and the surface points of 3D P-OCT (see the purple point cloud). (B) 3D P-OCT
results of different compensation for response hysteresis using path errors. (C) Filament size (FS) distribution of (B), and the blue color and the yellow
color indicated the larger and small FS values at the start-stop points, respectively. (D) Layer thickness (LT) distribution of (B), and the black and white
color indicated the larger and smaller LT values at the start-stop points. (E) 3D P-OCT results of different compensation parameters in the pre-experiment.
(F) FS distribution of (E). (G) LT distribution of (E). (H) The result of surface fitting. (I) The printing results after feedback with response hysteresis
compensation. (J) FS distribution of (I). (K) LT distribution of (I).
Volume 9 Issue 1 (2023) 54 https://doi.org/10.18063/ijb.v9i1.624