
Page 295 - IJB-9-2
P. 295
International Journal of Bioprinting Methodology of hydrogel printability
Table 5. Example of calculation for the printing grid test
Real value Theoretical Standard
(mm ) value (mm ) deviation
2
2
Row 1 17.33 20.41 2.18
Row 2 36.33 40.83 3.18
Row 3 55.08 61.24 4.35
Row 4 74.40 81,.66 5.13
Row 5 98.68 102.06 2.39
The hydrogel used in this test was GelMA 5%. In this table, from the
bottom (row 1) to the top (row 5), the data of the largest squares of the
grid (right) have been included.
is measured using the Equations II and III described in
section 3.3 (Figure 8).
4. Discussion
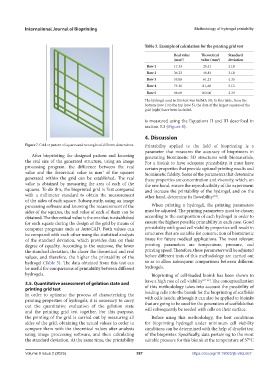
Figure 7. Grid or pattern of squares and rectangles of different dimensions. Printability applied to the field of bioprinting is a
parameter that measures the accuracy of bioprinters in
After bioprinting the designed pattern and knowing generating biomimetic 3D structures with biomaterials.
the real size of the generated structure, using an image For a bioink to have adequate printability, it must have
processing program, the difference between the real certain properties that provide optimal printing results and
value and the theoretical value in mm of the squares biomimetic fidelity. Some of the parameters that determine
2
generated within the grid can be established. The real these properties are concentration and viscosity, which, on
value is obtained by measuring the area of each of the the one hand, ensure the reproducibility of the experiment
squares. To do this, the bioprinted grid is first compared and increase the printability of the hydrogel, and on the
with a millimeter standard to obtain the measurement other hand, determine its flowability .
[14]
of the sides of each square. Subsequently, using an image
processing software and knowing the measurement of the When printing a hydrogel, the printing parameters
sides of the squares, the real value of each of them can be must be adjusted. The printing parameters must be chosen
obtained. The theoretical value is the one that is established according to the composition of each hydrogel in order to
for each square during the design of the grid by means of ensure the highest possible printability in each case. Good
computer programs such as AutoCAD. Both values can printability with good cell viability properties will result in
be compared with each other using the statistical analysis structures that are suitable for construction of biomimetic
of the standard deviation, which provides data on their tissue for future medical applications. The most relevant
degree of equality. According to the outcome, the lower printing parameters are temperature, pressure, and
the standard deviation, the closer the theoretical and real printing speed. Therefore, these parameters will be adjusted
values, and therefore, the higher the printability of the before different tests of this methodology are carried out
hydrogel (Table 5). The data obtained from this test can so as to allow subsequent comparisons between different
be useful for comparisons of printability between different hydrogels.
hydrogels. Bioprinting of cell-loaded bioink has been shown to
have a high rate of cell viability [27-29] . The conceptualization
3.5. Quantitative assessment of gelation state and of this methodology takes into account the possibility of
printing grid test loading cells into the bioink for the bioprinting of scaffolds
In order to optimize the process of characterizing the with cells inside, although it can also be applied to bioinks
printing properties of hydrogels, it is necessary to carry that are going to be used for the generation of scaffolds that
out the quantitative evaluation of the gelation state will subsequently be seeded with cells on their surface.
and the printing grid test together. For this purpose,
the printing of the grid is carried out by measuring all Before using this methodology, the best conditions
sides of the grid, obtaining the actual values in order to for bioprinting hydrogel under minimum cell viability
compare them with the theoretical values after analysis conditions can be determined with the help of droplet test
using image processing software, and then calculating of the bioprinter. Specifically, data pertaining to the most
the standard deviation. At the same time, the printability suitable pressure for this bioink at the temperature of 37°C
Volume 9 Issue 2 (2023) 287 https://doi.org/10.18063/ijb.v9i2.667