
Page 383 - IJB-9-2
P. 383
International Journal of Bioprinting 3D gel-printed β-TCP/TiO2 porous scaffolds for cancellous bone tissue engineering
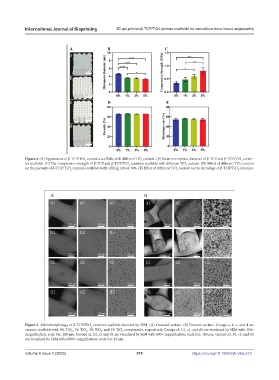
Figure 4. (A) Appearance of β-TCP/TiO ceramics scaffolds with different TiO content. (B) Mean micropores diameter of β-TCP and β-TCP/TiO ceram-
2
2
2
ics scaffolds. (C) The compressive strength of β-TCP and β-TCP/TiO ceramics scaffolds with different TiO content. (D) Effect of different TiO content
2
2
2
on the porosity of β-TCP/ TiO ceramics scaffolds with a filling rate of 30%. (E) Effect of different TiO content on the shrinkage of β-TCP/TiO ceramics.
2
2
2
Figure 5. Micromorphology of β-TCP/TiO ceramics scaffolds detected by SEM. (A) Outward surface. (B) Fracture surface. Groups a, b, c, and d are
2
ceramic scaffolds with 0% TiO , 1% TiO , 3% TiO , and 5% TiO components, respectively. Groups a1, b1, c1, and d1 are visualized by SEM with 300×
2
2
2
2
magnification; scale bar: 200 μm. Groups a2, b2, c2 and d2 are visualized by SEM with 600× magnification; scale bar: 100 μm. Groups a3, b3, c3, and d3
are visualized by SEM with 6000× magnification; scale bar: 10 μm.
Volume 9 Issue 2 (2023) 375 https://doi.org/10.18063/ijb.v9i2.673