
Page 106 - IJB-9-3
P. 106
International Journal of Bioprinting The biological properties of WE43 scaffolds via the oxidative heat strategy
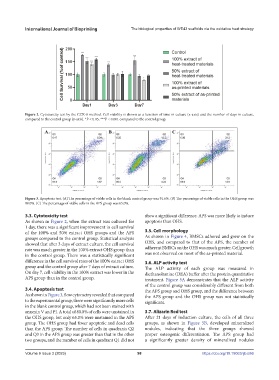
Figure 2. Cytotoxicity test by the CCK-8 method. Cell viability is shown as a function of time in culture (x-axis) and the number of days in culture,
compared to the control group (y-axis). *P < 0.05, ***P < 0.001 compared to the control group.
Figure 3. Apoptosis test. (A) The percentage of viable cells in the blank control group was 91.6%. (B) The percentage of viable cells in the OHS group was
80.0%. (C) The percentage of viable cells in the APS group was 65.0%.
3.3. Cytotoxicity test show a significant difference. APS was more likely to induce
As shown in Figure 2, when the extract was cultured for apoptosis than OHS.
1 day, there was a significant improvement in cell survival
of the 100% and 50% extract OHS groups and the APS 3.5. Cell morphology
groups compared to the control group. Statistical analysis As shown in Figure 4, BMSCs adhered and grew on the
showed that after 3 days of extract culture, the cell survival OHS, and compared to that of the APS, the number of
rate was much greater in the 100% extract OHS group than adherent BMSCs on the OHS was much greater. Cell growth
in the control group. There was a statistically significant was not observed on most of the as-printed material.
difference in the cell survival rates of the 100% extract OHS 3.6. ALP activity test
group and the control group after 7 days of extract culture. The ALP activity of each group was measured in
On day 7, cell viability in the 100% extract was lower in the diethanolamine (DEA) buffer after the protein quantitative
APS group than in the control group. treatment. Figure 5A demonstrates that the ALP activity
of the control group was considerably different from both
3.4. Apoptosis test the APS group and OHS group, and the difference between
As shown in Figure 3, flow cytometry revealed that compared the APS group and the OHS group was not statistically
to the experimental group, there were significantly more cells significant.
in the blank control group, which had not been stained with
annexin V and PI. A total of 80.0% of cells were unstained in 3.7. Alizarin Red test
the OHS group, but only 65.0% were unstained in the APS After 21 days of induction culture, the cells of all three
group. The OHS group had fewer apoptotic and dead cells groups, as shown in Figure 5B, developed mineralized
than the APS group. The number of cells in quadrants Q2 nodules, indicating that the three groups showed
and Q3 in the APS group was greater than that in the other proper osteogenic differentiation. The APS group had
two groups, and the number of cells in quadrant Q1 did not a significantly greater density of mineralized nodules
Volume 9 Issue 3 (2023) 98 https://doi.org/10.18063/ijb.686