
Page 172 - IJB-9-3
P. 172
International Journal of Bioprinting Flow performance of porous implants with different geometry
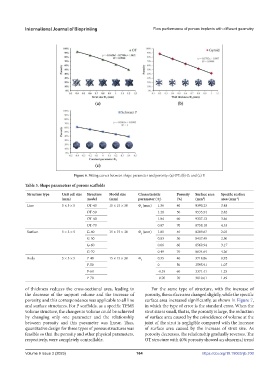
Figure 6. Fitting curves between shape parameter and porosity: (a) OT; (b) G; and (c) P.
Table 3. Shape parameters of porous scaffolds
Structure type Unit cell size Structure Model size Characteristic Porosity Surface area Specific surface
(mm) model (mm) parameter (Φ ) (%) (mm ) area (mm )
2
-1
i
Line 5 × 5 × 5 OT-40 15 × 15 × 30 Φ (mm) 1.36 40 9390.23 3.48
1
OT-50 1.20 50 9533.54 2.82
OT-60 1.04 60 9337.13 3.46
OT-70 0.87 70 8758.18 4.33
Surface 5 × 5 × 5 G-40 15 × 15 × 30 Φ (mm) 1.01 40 8209.67 2.03
2
G-50 0.83 50 8437.49 2.50
G-60 0.66 60 8569.94 3.17
G-70 0.49 70 8634.64 4.26
Body 5 × 5 × 5 P-40 15 × 15 × 30 Φ 0.35 40 3718.86 0.92
3
P-50 0 50 3595.91 1.07
P-60 -0.35 60 3371.41 1.25
P-70 -0.70 70 3010.61 1.49
of thickness reduces the cross-sectional area, leading to For the same type of structure, with the increase of
the decrease of the support volume and the increase of porosity, the surface area changed slightly, while the specific
porosity, and this correspondence was applicable to all line surface area increased significantly, as shown in Figure 7,
and surface structures. For P scaffolds, as a specific TPMS in which the type of error is the standard error. When the
volume structure, the changes in volume could be achieved strut size is small, that is, the porosity is large, the reduction
by changing only one parameter and the relationship of surface area caused by the coincidence of volume at the
between porosity and this parameter was linear. Thus, joint of the strut is negligible compared with the increase
quantitative design for three types of porous structures was of surface area caused by the increase of strut size. As
feasible so that the porosity and other physical parameters, porosity decreases, the relationship gradually reverses. The
respectively, were completely controllable. OT structure with 40% porosity showed an abnormal trend
Volume 9 Issue 3 (2023) 164 https://doi.org/10.18063/ijb.700