
Page 171 - IJB-9-3
P. 171
International Journal of Bioprinting Flow performance of porous implants with different geometry
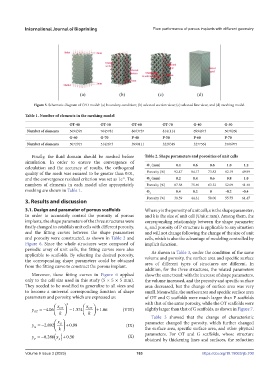
Figure 5. Schematic diagram of CFD model: (a) boundary condition; (b) selected section view; (c) selected line view; and (d) meshing model.
Table 1. Number of elements in the meshing model
OT-40 OT-50 OT-60 OT-70 G-40 G-50
Number of elements 5694395 7645781 8683737 8141114 6994673 5678260
G-60 G-70 P-40 P-50 P-60 P-70
Number of elements 5072915 5142673 3990111 3228349 3277564 3586975
Finally, the fluid domain should be meshed before Table 2. Shape parameters and porosities of unit cells
simulation. In order to ensure the convergence of Φ (mm) 0.4 0.6 0.8 1.0 1.2
calculation and the accuracy of results, the orthogonal 1
quality of the mesh was ensured to be greater than 0.01, Porosity (%) 92.47 84.17 73.83 62.19 49.99
and the convergence residual criterion was set as 1e . The Φ (mm) 0.2 0.4 0.6 0.8 1.0
-5
2
numbers of elements in each model after appropriately Porosity (%) 87.58 75.40 63.53 52.09 41.40
meshing are shown in Table 1. Φ 0.4 0.2 0 -0.2 -0.4
3
Porosity (%) 38.59 44.31 50.00 55.75 61.47
3. Results and discussion
3.1. Design and parameter of porous scaffolds Where y is the porosity of unit cell; x is the shape parameter;
In order to accurately control the porosity of porous and k is the size of unit cell (Units: mm). Among them, the
implants, the shape parameters of the three structures were corresponding relationship between the shape parameter
firstly changed to establish unit cells with different porosity, x and porosity of P structure is applicable to any situation
P
and the fitting curves between the shape parameters and will not change following the change of the size of unit
and porosity were constructed, as shown in Table 2 and cells, which is also the advantage of modeling controlled by
Figure 6. Since the whole structures were composed of implicit function.
periodic array of unit cells, the fitting curves were also
applicable to scaffolds. By selecting the desired porosity, As shown in Table 3, under the condition of the same
the corresponding shape parameters could be obtained volume and porosity, the surface area and specific surface
from the fitting curve to construct the porous implant. area of different types of structures are different. In
addition, for the three structures, the related parameters
Moreover, these fitting curves in Figure 6 applied show the same trend: with the increase of shape parameters,
only to the cell size used in this study (5 × 5 × 5 mm). the volume increased, and the porosity and specific surface
They needed to be modified to generalize to all sizes and area decreased, but the change of surface area was very
to become a universal corresponding function of shape small. Meanwhile, the surface area and specific surface area
parameters and porosity, which are expressed as: of OT and G scaffolds were much larger than P scaffolds
x 2 x with that of the same porosity, while the OT scaffolds were
y =−406. OT −1 374. OT +106. (VIII) slightly larger than that of G scaffolds, as shown in Figure 7.
OT k k
Table 3 showed that the change of characteristic
x parameter changed the porosity, which further changed
.
y =−2 892 G + 099. (IX)
G k the surface area, specific surface area, and other physical
y =−0 286. x ( ) + 050. (X) parameters. For OT and G scaffolds, whose structure
P p obtained by thickening lines and surfaces, the reduction
Volume 9 Issue 3 (2023) 163 https://doi.org/10.18063/ijb.700