
Page 175 - IJB-9-3
P. 175
International Journal of Bioprinting Flow performance of porous implants with different geometry
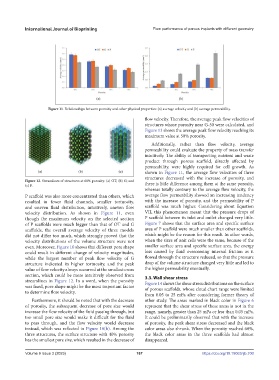
Figure 11. Relationships between porosity and other physical properties: (a) average velocity and (b) average permeability.
flow velocity. Therefore, the average peak flow velocities of
structures whose porosity near G-50 were calculated, and
Figure 13 shows the average peak flow velocity reaching its
maximum value at 50% porosity.
Additionally, rather than flow velocity, average
permeability could evaluate the property of mass transfer
intuitively. The ability of transporting nutrient and waste
product through porous scaffold, directly affected by
permeability, were highly required for cell growth. As
shown in Figure 11, the average flow velocities of three
structures decreased with the increase of porosity, and
Figure 12. Streamlines of structures at 60% porosity: (a) OT; (b) G; and
(c) P. there is little difference among them at the same porosity,
whereas totally contrary to the average flow velocity, the
P scaffold was also more concentrated than others, which average flow permeability showed an increasing tendency
resulted in fewer fluid channels, smaller tortuosity, with the increase of porosity, and the permeability of P
and uneven fluid distribution, intuitively, uneven flow scaffold was much higher. Considering about Equation
velocity distribution. As shown in Figure 11, even VII, this phenomenon meant that the pressure drops of
though the maximum velocity on the selected section P scaffold between its inlet and outlet changed very little.
of P scaffolds were much bigger than that of OT and G Figure 7 shows that the surface area and specific surface
scaffolds, the overall average velocity of three models area of P scaffold were much smaller than other scaffolds,
did not differ too much, which strongly proved that the which might be the reason for this result. In other words,
velocity distributions of the volume structure were not when the sizes of unit cells were the same, because of the
even. Moreover, Figure 10 shows that different pore shape smaller surface area and specific surface area, the energy
could result in different change of velocity magnitudes, loss caused by fluid overcoming internal friction as it
while the largest number of peak flow velocity of G flowed through the structure reduced, so that the pressure
structure indicated its higher tortuosity, and the peak drop of the volume structure changed very little and led to
value of flow velocity always occurred at the smallest cross the higher permeability eventually.
section, which could be more intuitively observed from 3.3. Wall shear stress
streamlines in Figure 12. In a word, when the porosity Figure 14 shows the shear stress distributions on the surface
was fixed, pore shape might be the most important factor of porous scaffolds, whose cloud chart range were limited
to determine flow velocity.
from 0.05 to 25 mPa after considering former theory of
Furthermore, it should be noted that with the decrease other study. The areas marked in black color in Figure 6
of porosity, the subsequent decrease of pore size would represent that the shear stress of these areas is not in the
increase the flow velocity of the fluid passing through, but range, namely, greater than 25 mPa or less than 0.05 mPa.
too small pore size would make it difficult for the fluid It could be preliminarily observed that with the increase
to pass through, and the flow velocity would decrease of porosity, the peak shear stress decreased and the black
instead, which was reflected in Figure 10(b). Among the color areas also shrunk. When the porosity reached 60%,
three structures, the surface structure with 40% porosity the black color areas in the three scaffolds had almost
has the smallest pore size, which resulted in the decrease of disappeared.
Volume 9 Issue 3 (2023) 167 https://doi.org/10.18063/ijb.700