
Page 174 - IJB-9-3
P. 174
International Journal of Bioprinting Flow performance of porous implants with different geometry
with the increase of the porosity, but on the contrary, magnitude and the permeability growth rate of P scaffolds
the average permeability of models showed increasing was obviously higher than that of OT and G scaffolds.
trend. The statistical analysis showed that the P-value of There are some obvious differences in average permeability
average velocity of three models is less than 0.05, which between the porous implants of this study and natural
indicates significant statistical difference. The permeability bone tissues. The permeability values of cancellous bone
obtained from the experimental study ranged from 2.56 ×
10 to 7.43 × 10 m (the cancellous bone samples were
−11
2
−8
taken from calcaneal vertebra, femur and spine, etc.) [30-34] .
Besides, these studies showed that the permeability
increased with the increase of porosity, but decreased
with the increase of bone surface area, which is consistent
with the findings of this study. The permeabilities of OT
structures and G structures whose surface areas were far
more than that of P structures were in the range of those
of natural bone tissue. In addition, this study mainly
simulated the situation of porous implants growing cells
in an in vitro culture environment, so the materials and
boundary conditions used were all simulated in in vitro
experiments, which also affected the result of permeability
compared with natural bone tissue.
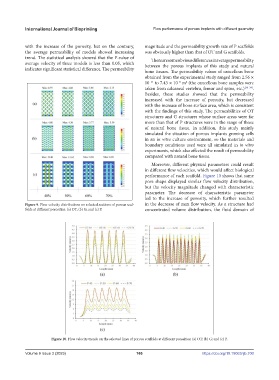
Moreover, different physical parameters could result
in different flow velocities, which would affect biological
performance of each scaffold. Figure 10 shows that same
pore shape displayed similar flow velocity distribution,
but the velocity magnitude changed with characteristic
parameter. The decrease of characteristic parameter
led to the increase of porosity, which further resulted
Figure 9. Flow velocity distributions on selected sections of porous scaf- in the decrease of max flow velocity. As a structure had
folds at different porosities: (a) OT; (b) G; and (c) P. concentrated volume distribution, the fluid domain of
Figure 10. Flow velocity trends on the selected lines of porous scaffolds at different porosities: (a) OT; (b) G; and (c) P.
Volume 9 Issue 3 (2023) 166 https://doi.org/10.18063/ijb.700