
Page 173 - IJB-9-3
P. 173
International Journal of Bioprinting Flow performance of porous implants with different geometry
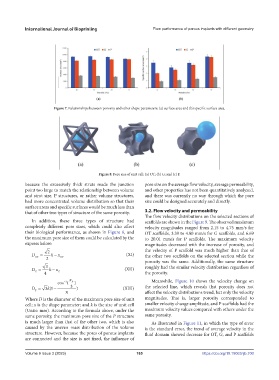
Figure 7. Relationships between porosity and other shape parameters: (a) surface area and (b) specific surface area.
Figure 8. Pore size of unit cell: (a) OT; (b) G; and (c) P.
because the excessively thick struts made the junction pore size on the average flow velocity, average permeability,
point too large to match the relationship between volume and other properties has not been quantitatively analyzed,
and strut size. P structures, or rather volume structures, and there was currently no way through which the pore
had more concentrated volume distribution so that their size could be designed accurately and directly.
surface areas and specific surfaces would be much less than
that of other two types of structure of the same porosity. 3.2. Flow velocity and permeability
The flow velocity distributions on the selected sections of
In addition, these three types of structure had scaffolds are shown in the Figure 9. The observed maximum
completely different pore sizes, which could also affect velocity magnitudes ranged from 2.15 to 4.75 mm/s for
their biological performance, as shown in Figure 8, and OT scaffolds, 3.39 to 4.80 mm/s for G scaffolds, and 6.69
the maximum pore size of them could be calculated by the to 20.01 mm/s for P scaffolds. The maximum velocity
express below: magnitudes decreased with the increase of porosity, and
2 the velocity of P scaffold was much higher than that of
D = kx− (XI) the other two scaffolds on the selected section while the
OT 2 OT
porosity was the same. Additionally, the same structure
3 roughly had the similar velocity distribution regardless of
D = kx− (XII)
G 4 G the porosity.
x
cos( P ) Meanwhile, Figure 10 shows the velocity change on
−1
k −
D = 31( 3 ) (XIII) the selected line, which reveals that porosity does not
P π affect the velocity distributions trend, but only the velocity
Where D is the diameter of the maximum pore size of unit magnitudes. That is, larger porosity corresponded to
cell; x is the shape parameter; and k is the size of unit cell smaller velocity change amplitude, and P scaffolds had the
(Units: mm). According to the formula above, under the maximum velocity values compared with others under the
same porosity, the maximum pore size of the P structure same porosity.
is much larger than that of the other two, which is also As illustrated in Figure 11, in which the type of error
caused by the uneven mass distribution of the volume is the standard error, the trend of average velocity in the
structure. However, because the pores of porous implants fluid domain showed decrease for OT, G, and P scaffolds
are connected and the size is not fixed, the influence of
Volume 9 Issue 3 (2023) 165 https://doi.org/10.18063/ijb.700