
Page 176 - IJB-9-3
P. 176
International Journal of Bioprinting Flow performance of porous implants with different geometry
Figure 13. Average peak velocity of G structure near 50% porosity.
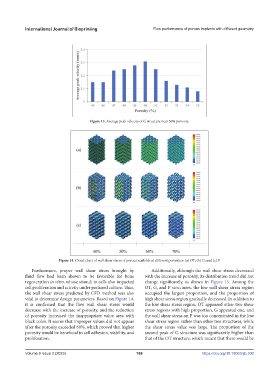
Figure 14. Cloud chart of wall shear stress of porous scaffolds at different porosities: (a) OT; (b) G; and (c) P.
Furthermore, proper wall shear stress brought by Additionally, although the wall shear stress decreased
fluid flow had been shown to be favorable for bone with the increase of porosity, its distribution trend did not
regeneration in vitro, whose stimuli to cells also impacted change significantly, as shown in Figure 15. Among the
cell proliferation and activity under perfused culture. Thus, OT, G, and P structures, the low wall shear stress region
the wall shear stress predicted by CFD method was also occupied the largest proportion, and the proportion of
vital to determine design parameters. Based on Figure 14, high shear stress region gradually decreased. In addition to
it is confirmed that the flow wall shear stress would the low shear stress region, OT appeared other two shear
decrease with the increase of porosity, and the reduction stress regions with high proportion, G appeared one, and
of porosity increased the inappropriate value area with the wall shear stress on P was too concentrated in the low
black color. It seems that improper values did not appear shear stress region rather than other two structures, while
after the porosity exceeded 60%, which proved that higher the shear stress value was large. The proportion of the
porosity would be beneficial to cell adhesion, viability, and second peak of G structure was significantly higher than
proliferation. that of the OT structure, which meant that there would be
Volume 9 Issue 3 (2023) 168 https://doi.org/10.18063/ijb.700