
Page 15 - IJB-9-4
P. 15
International Journal of Bioprinting Biomimetic 3D printed glioma model
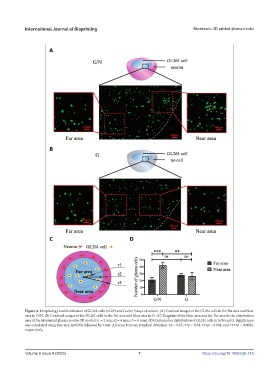
Figure 4. Morphology and distribution of GL261 cells in G/N and G after 5 days of culture. (A) Confocal images of the GL261 cells in the Far area and Near
area in G/N. (B) Confocal images of the GL261 cells in the Far area and Near area in G. (C) Diagram of the Near area and the Far area in the observation
area of the bioprinted glioma in vitro 3D model (r1 = 2 mm, r2 = 4 mm, r3 = 6 mm). (D) Cell number distribution of GL261 cells in G/N and G. Significance
was calculated using two-way ANOVA followed by t-test. All error bars are standard deviation. ∗p < 0.05, ∗∗p < 0.01, ∗∗∗p < 0.001, and ∗∗∗∗p < 0.0001,
respectively.
Volume 9 Issue 4 (2023) 7 https://doi.org/10.18063/ijb.715