
Page 16 - IJB-9-4
P. 16
International Journal of Bioprinting Biomimetic 3D printed glioma model
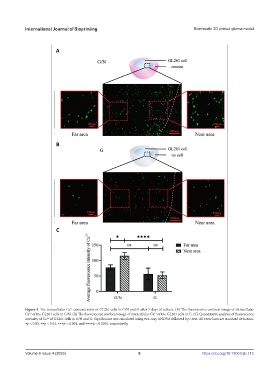
Figure 5. The intracellular Ca concentration of GL261 cells in G/N and G after 5 days of culture. (A) The fluorescence confocal image of intracellular
2+
Ca of the GL261 cells in G/N. (B) The fluorescence confocal image of intracellular Ca of the GL261 cells in G. (C) Quantitative analysis of fluorescence
2+
2+
intensity of Ca of GL261 cells in G/N and G. Significance was calculated using two-way ANOVA followed by t-test. All error bars are standard deviation.
2+
∗p < 0.05, ∗∗p < 0.01, ∗∗∗p < 0.001, and ∗∗∗∗p < 0.0001, respectively.
Volume 9 Issue 4 (2023) 8 https://doi.org/10.18063/ijb.715