
Page 236 - IJB-9-4
P. 236
International Journal of Bioprinting Agar production residue for 3D printing
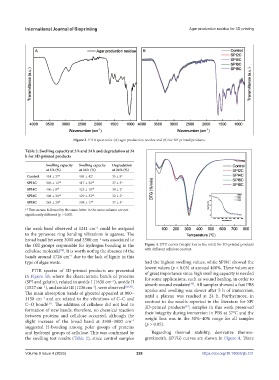
Figure 3. FTIR spectra for (A) agar production residue and (B) for 3D-printed products.
Table 2. Swelling capacity at 5 h and 24 h and degradation at 24
h for 3D-printed products
Swelling capacity Swelling capacity Degradation
at 5 h (%) at 24 h (%) at 24 h (%)
Control 454 ± 37 a 484 ± 42 a 35 ± 8 a
SPI2C 396 ± 12 ab 417 ± 32 ab 37 ± 5 a
SPI4C 406 ± 8 ab 425 ± 10 ab 38 ± 2 a
SPI6C 408 ± 28 ab 429 ± 33 ab 32 ± 2 a
SPI8C 385 ± 20 b 398 ± 17 b 37 ± 5 a
a-b Two means followed by the same letter in the same column are not
significantly different (p > 0.05).
the weak band observed at 1241 cm could be assigned
−1
to the pyranose ring bending vibrations in agarose. The
broad band between 3000 and 3500 cm was associated to
−1
the OH groups responsible for hydrogen bonding in the Figure 4. DTG curves (weight loss in the inlet) for 3D-printed products
cellulose molecule . It is worth noting the absence of the with different cellulose content.
[28]
bands around 1726 cm due to the lack of lignin in this
−1
type of algae waste. had the highest swelling values, while SPI8C showed the
lowest values (p < 0.05) at around 400%. These values are
FTIR spectra of 3D-printed products are presented
in Figure 3B, where the characteristic bands of proteins of great importance since high swelling capacity is needed
for some applications, such as wound healing, in order to
(SPI and gelatin), related to amide I (1630 cm ), amide II absorb wound exudates . All samples showed a fast PBS
−1
[32]
(1527 cm ), and amide III (1236 cm ), were observed [29,30] . uptake and swelling was slower after 5 h of immersion,
−1
−1
The main absorption bands of glycerol appeared at 800– until a plateau was reached at 24 h. Furthermore, in
1150 cm and are related to the vibrations of C–C and contrast to the results reported in the literature for SPI
−1
C–O bonds . The addition of cellulose did not lead to 3D-printed products , samples in this work preserved
[31]
[33]
formation of new bands; therefore, no chemical reaction their integrity during immersion in PBS at 37°C and the
between proteins and cellulose occurred, although the weight loss was in the 30%–40% range for all samples
slight increase of the broad band at 3500–3000 cm (p > 0.05).
−1
suggested H-bonding among polar groups of proteins
and hydroxyl groups of cellulose. This was confirmed by Regarding thermal stability, derivative thermo-
the swelling test results (Table 2), since control samples gravimetric (DTG) curves are shown in Figure 4. There
Volume 9 Issue 4 (2023) 228 https://doi.org/10.18063/ijb.731