
Page 235 - IJB-9-4
P. 235
International Journal of Bioprinting Agar production residue for 3D printing
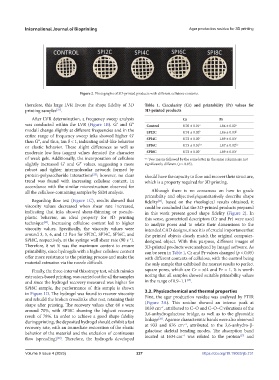
Figure 2. Photographs of 3D-printed products with different cellulose contents.
therefore, this large LVR favors the shape fidelity of 3D Table 1. Circularity (Cr) and printability (Pr) values for
printing samples . 3D-printed products
[21]
After LVR determination, a frequency sweep analysis Cr Pr
was conducted within the LVR (Figure 1B). G′ and G″ Control 0.76 ± 0.01 a 1.04 ± 0.02 a
moduli change slightly at different frequencies and in the SPI2C 0.74 ± 0.02 b 1.06 ± 0.03 b
entire range of frequency sweep inks showed higher G′ SPI4C c c
than G″, and thus, tan δ < 1, indicating solid-like behavior 0.72 ± 0.02 1.09 ± 0.03
or elastic behavior. These slight differences as well as SPI6C 0.73 ± 0.01 b,c 1.07 ± 0.02 b,c
moderate low loss tangent values denoted the character SPI8C 0.72 ± 0.02 c 1.09 ± 0.03 c
of weak gels. Additionally, the incorporation of cellulose a-c Two means followed by the same letter in the same column are not
slightly increased G′ and G″ values, suggesting a more significantly different (p > 0.05).
robust and tighter intermolecular network formed by
protein-polysaccharide interactions ; however, no clear should have the capacity to flow and recover their structure,
[22]
trend was found with increasing cellulose content, in which is a property required for 3D printing.
accordance with the similar microstructure observed for
all the cellulose-containing samples by SEM analysis. Although there is no consensus on how to grade
printability and objectively/quantitatively describe shape
Regarding flow test (Figure 1C), results showed that fidelity , based on the rheological results obtained, it
[24]
viscosity values decreased when shear rate increased, could be concluded that the 3D-printed products prepared
indicating that inks showed shear-thinning or pseudo- in this work present good shape fidelity (Figure 2). In
plastic behavior, an ideal property for 3D printing this sense, geometrical descriptors (Cr and Pr) were used
technique . Increasing cellulose content led to higher to analyze pores and to relate their dimensions to the
[23]
viscosity values. Specifically, the viscosity values were intended CAD designs, since it is of crucial importance that
around 3, 5, 6, and 12 Pa·s for SPI2C, SPI4C, SPI6C, and the printed objects closely match the original computer-
SPI8C, respectively, at the syringe wall shear rate (90 s ). designed object. With this purpose, different images of
−1
Therefore, 8 wt % was the maximum content to ensure 3D-printed products were analyzed by ImageJ software. As
printability, since hydrogels with a higher cellulose content can be seen in Table 1, Cr and Pr values changed (p < 0.05)
offer more resistance to the printing process and make the with different contents of cellulose, with the control being
material extrusion via the nozzle difficult. the only sample that exhibited the nearest results to perfect
Finally, the three-interval thixotropy test, which mimics square pores, which are Cr = π/4 and Pr = 1. It is worth
extrusion-based printing, was carried out for all the samples noting that all samples showed suitable printability values
[25]
and since the hydrogel recovery measured was higher for in the range of 0.9–1.1 .
SPI8C sample, the performance of this sample is shown
in Figure 1D. The hydrogel was found to recover viscosity 3.2. Physicochemical and thermal properties
and rebuild the broken crosslinks after rest, retaining their First, the agar production residue was analyzed by FTIR
shape after printing. The recovery values after 60 s were (Figure 3A). This residue showed an intense peak at
−1
around 70%, with SPI8C showing the highest recovery 1030 cm , attributed to C–O and C–O–C vibrations of the
result of 78%. In order to achieve a good shape fidelity 3,6-anhydrogalactose bridge, as well as to the glycosidic
[26]
during printing, the deposited hydrogel should exhibit a fast linkage . Agarose characteristic bands were also observed
−1
recovery rate, with an immediate restoration of the elastic at 933 and 876 cm , attributed to the 3,6-anhydro-β-
behavior of the material and the exclusion of continuous galactose skeletal bending modes. The absorption band
−1
[27]
flow (spreading) . Therefore, the hydrogels developed located at 1634 cm was related to the protein and
[20]
Volume 9 Issue 4 (2023) 227 https://doi.org/10.18063/ijb.731