
Page 234 - IJB-9-4
P. 234
International Journal of Bioprinting Agar production residue for 3D printing
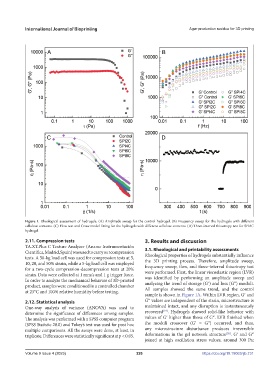
Figure 1. Rheological assessment of hydrogels. (A) Amplitude sweep for the control hydrogel. (B) Frequency sweep for the hydrogels with different
cellulose contents. (C) Flow test and Cross model fitting for the hydrogels with different cellulose contents. (D) Three-interval thixotropy test for SPI8C
hydrogel.
2.11. Compression tests 3. Results and discussion
TA.XT.Plus C Texture Analyzer (Aname Instrumentación
Científica, Madrid, Spain) was used to carry out compression 3.1. Rheological and printability assessments
tests. A 50-kg load cell was used for compression tests at 5, Rheological properties of hydrogels substantially influence
10, 20, and 50% strain, while a 5-kg load cell was employed the 3D printing process. Therefore, amplitude sweep,
for a two-cycle compression-decompression tests at 20% frequency sweep, flow, and three-interval thixotropy test
strain. Data were collected at 1 mm/s and 1 g trigger force. were performed. First, the linear viscoelastic region (LVR)
In order to analyze the mechanical behavior of 3D-printed was identified by performing an amplitude sweep and
product, samples were conditioned in a controlled chamber analyzing the trend of storage (G′) and loss (G″) moduli.
at 23°C and 100% relative humidity before testing. All samples showed the same trend, and the control
sample is shown in Figure 1A. Within LVR region, G′ and
2.12. Statistical analysis G″ values are independent of the strain, microstructure is
One-way analysis of variance (ANOVA) was used to maintained intact, and any disruption is instantaneously
[19]
determine the significance of differences among samples. recovered . Hydrogels showed solid-like behavior with
The analysis was performed with a SPSS computer program values of G′ higher than those of G″. LVR finished when
(SPSS Statistic 28.0) and Tukey’s test was used for post hoc the moduli crossover (G′ = G″) occurred, and thus,
multiple comparisons. All the assays were done, at least, in any microstructure disturbance produces irreversible
[20]
triplicate. Differences were statistically significant at p < 0.05. deformations in the gel network structure . G′ and G″
joined at high oscillation stress values, around 300 Pa;
Volume 9 Issue 4 (2023) 226 https://doi.org/10.18063/ijb.731