
Page 237 - IJB-9-4
P. 237
International Journal of Bioprinting Agar production residue for 3D printing
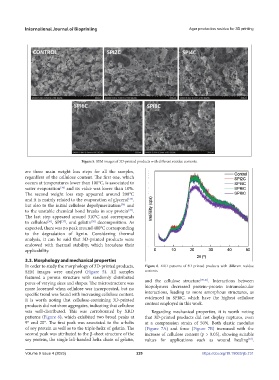
Figure 5. SEM images of 3D-printed products with different residue contents.
are three main weight loss steps for all the samples,
regardless of the cellulose content. The first one, which
occurs at temperatures lower than 100°C, is associated to
water evaporation and its value was lower than 10%.
[34]
The second weight loss step appeared around 200°C
and it is mainly related to the evaporation of glycerol ,
[35]
but also to the initial cellulose depolymerization and
[36]
to the unstable chemical bond breaks in soy protein .
[37]
The last step appeared around 310°C and corresponds
to cellulose , SPI , and gelatin decomposition. As
[38]
[37]
[36]
expected, there was no peak around 400°C corresponding
to the degradation of lignin. Considering thermal
analysis, it can be said that 3D-printed products were
endowed with thermal stability, which broadens their
applicability.
3.3. Morphology and mechanical properties
In order to study the morphology of 3D-printed products, Figure 6. XRD patterns of 3D-printed products with different residue
SEM images were analyzed (Figure 5). All samples contents.
featured a porous structure with randomly distributed [39-41]
pores of varying sizes and shapes. The microstructure was and the cellulose structure . Interactions between
more loosened when cellulose was incorporated, but no biopolymers decreased protein–protein intramolecular
specific trend was found with increasing cellulose content. interactions, leading to more amorphous structures, as
It is worth noting that cellulose-containing 3D-printed evidenced in SPI8C, which have the highest cellulose
products did not show aggregates, indicating that cellulose content employed in this work.
was well-distributed. This was corroborated by XRD Regarding mechanical properties, it is worth noting
patterns (Figure 6), which exhibited two broad peaks at that 3D-printed products did not display ruptures, even
9° and 20°. The first peak was associated to the α-helix at a compression strain of 50%. Both elastic modulus
of soy protein as well as to the triple-helix of gelatin. The (Figure 7A) and force (Figure 7B) increased with the
second peak was attributed to the β-sheet structure of the increase of cellulose content (p > 0.05), showing suitable
soy protein, the single left-handed helix chain of gelatin, values for applications such as wound healing .
[42]
Volume 9 Issue 4 (2023) 229 https://doi.org/10.18063/ijb.731