
Page 65 - IJB-9-5
P. 65
International Journal of Bioprinting 3D-printed PLA-BG composite induces angiogenesis
Table 1. Primer sequences
Gene Forward primer (5′ to 3′) Reverse primer (5′ to 3′)
GAPDH CGA CCA CTT TGT CAA GCT CA AGG GGA GAT TCA TGT TGG TG
CD31 CAT TGG CGT GTT GGG AAG AA GCT CAT GTT TGC CTA GCT CC
KDR TTA CTT GCA GGG GAC AGA GG TTC CCG GTA GAA GCA CTT GT
BXFM, OLYMPUS DEUTSCHLAND GmbH, Hamburg,
Germany). The analysis of the vascular density was carried
out using ImageJ .
[33]
2.9. Statistical analysis
Statistical analyses were performed using the software
GraphPad Prism. The results are presented as medians and
quartiles. Measurements were carried out in triplicates.
Cell-based experiments were independently repeated three
times. Normally distributed data were analyzed by one-
way analysis of variance (ANOVA). Depending on Levene’s
test for equality of variances, pairwise comparisons were
conducted either by a Tukey–HSD or Games–Howell
post hoc test. In contrast, non-normally distributed data
were evaluated with the Kruskal–Wallis test followed
by a Bonferroni-corrected Conover–Iman analysis. For
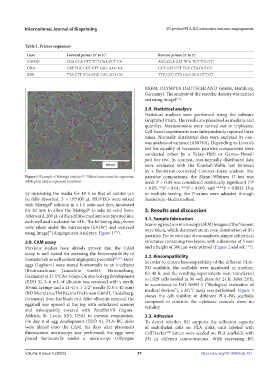
Figure 1. Example of Matrigel analysis . Yellow lanes show the segments, pairwise comparisons, the Mann–Whitney U test was
[33]
while pink circles represent junctions. used. P < 0.05 was considered statistically significant (*P
< 0.05, **P < 0.01, ***P < 0.005, and ****P < 0.001). Due
by incubating the media for 48 h so that all solutes can to multiple testing, the P-values were adjusted through
be fully absorbed. 5 × 10 /100 µL HUVECs were mixed Bonferroni–Holm method.
4
with Matrigel® solution in a 1:1 ratio and then incubated
for 30 min to allow the Matrigel® to take its solid form. 3. Results and discussion
Afterward, 200 µL of the additive medium was pipetted into 3.1. Sample fabrication
each well and incubated for 24 h. The following day, photos Scanning electron microscopy (SEM) images of the filament
were taken under the microscope (EVOS®) and analyzed were taken, which demonstrate an even distribution of BG
using ImageJ® (Angiogenesis Analyzer; Figure 1 ).
[33]
particles. For in vitro and in ovo analyses, simple cylindrical
2.8. CAM assay structures containing two layers, with a diameter of 5 mm
[17]
Previous studies have already proven that the CAM and a height of 300 µm were printed (Figure 2 and ref. ).
assay is well suited for assessing the biocompatibility of 3.2. Biocompatibility
biomaterials as well as their angiogenic potential [34,35] . Hens’ In order to ensure biocompatibility of the different PLA–
eggs (Leghorn) were stored horizontally in an incubator BG scaffolds, the scaffolds were incubated in medium
(Brutmaschinen Janeschitz GmbH, Hammelburg, for 48 h, and the resulting supernatants were transferred
Germany) at 37.5°C for 3 days. On day 3 of egg development to L929 cells seeded in 96-well plate for 24 h. After 24 h,
(EDD 3), 5–6 mL of albumin was removed with a sterile in accordance to ISO-10993-5 (“Biological evaluation of
10-mL syringe and a 21-G × 1-1/2″ needle (0.8 × 40 mm) medical devices”), a MTT assay was performed. Figure 3
(BD MicrolanceTM Becton Dickinson GmbH, Heidelberg, shows the cell viability in different PLA–BG scaffolds
Germany) from the blunt end. After albumin removal, the compared to controls; the cytotoxic controls show no
eggshell was opened at the top with autoclaved scissors viability.
and subsequently covered with ParafilmVR (Sigma-
Aldrich, St. Louis, MO, USA) to prevent evaporation. 3.3. Adhesion
On day 8 of egg development (EDD 8), PLA–BG disks To detect whether BG supports the adhesion capacity
were placed onto the CAM. Six days after placement of endothelial cells on PLA disks, cells labeled with
fluorescence microscopy was performed, the eggs were CellTracker Green were seeded on PLA scaffolds with
TM
placed horizontally under a microscope (Olympus BG in different concentrations. With increasing BG
Volume 9 Issue 5 (2023) 57 https://doi.org/10.18063/ijb.751