
Page 111 - IJB-9-6
P. 111
International Journal of Bioprinting Affordable temperature-controlled bioprinter
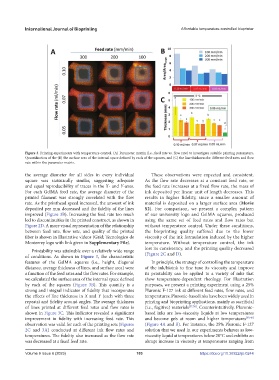
Figure 3. Printing experiments with temperature control. (A) Parameter matrix (i.e., feed rate vs. flow rate) to investigate suitable printing parameters.
Quantification of the (B) the surface area of the internal space defined by each of the squares, and (C) the line thickness for different feed rates and flow
rate within the parameter matrix.
the average diameter for all sides in every individual These observations were expected and consistent.
square was statistically similar, suggesting adequate As the flow rate decreases at a constant feed rate, or
and equal reproducibility of traces in the X- and Y-axes. the feed rate increases at a fixed flow rate, the mass of
For each GelMA feed rate, the average diameter of the ink deposited per linear unit of length decreases. This
printed filament was strongly correlated with the flow results in higher fidelity, since a smaller amount of
rate. As the printhead speed increased, the amount of ink material is deposited on a larger surface area (Movie
deposited per mm decreased and the fidelity of the lines S2). For comparison, we present a complex pattern
improved (Figure 3B). Increasing the feed rate too much of our university logo and GelMA squares, produced
led to discontinuities in the printed construct, as shown in using the same set of feed rates and flow rates but
Figure 2D. A more visual representation of the relationship without temperature control. Under these conditions,
between feed rate, flow rate, and quality of the printed the bioprinting quality suffered due to the lower
fiber is shown in illustrative videos (Grid; Tecnologico de viscosity of the ink formulation induced by the higher
Monterrey logo with link given in Supplementary File). temperature. Without temperature control, the ink
Printability was attainable over a relatively wide range lost its consistency, and the printing quality decreased
of conditions. As shown in Figure 3, the characteristic (Figure 2C and D).
features of the GelMA squares (i.e., height, diagonal In principle, the strategy of controlling the temperature
distance, average thickness of lines, and surface area) were of the ink/bioink to fine tune its viscosity and improve
a function of the feed rates and the flow rates. For example, its printability can be applied to a variety of inks that
we calculated the surface area of the internal space defined show temperature-dependent rheology. For illustration
by each of the squares (Figure 3B). This quantity is a purposes, we present a printing experiment using a 25%
strong and integral indicator of fidelity that incorporates Pluronic F-127 ink at different feed rates, flow rates, and
the effects of line thickness in X and Y (each with three temperatures. Pluronic-based inks have been widely used in
repeats) and fidelity around angles. The average thickness printing and bioprinting applications, mainly as sacrificial
of lines printed at different feed rates and flow rates is (i.e., fugitive) materials [37,38] . Counterintuitively, Pluronic-
shown in Figure 3C. This indicator revealed a significant based inks are low-viscosity liquids at low temperatures
improvement in fidelity with increasing feed rate. This and become gels at room and higher temperatures [39,40]
observation was valid for each of the printing sets (Figures (Figure 4A and B). For instance, the 25% Pluronic F-127
2C and 3A) conducted at different ink flow rates and solution that we used in our experiments behaves as low-
temperatures. The fidelity also increased as the flow rate viscosity liquid at temperatures below 20°C and exhibits an
was decreased at a fixed feed rate. abrupt increase in viscosity at temperatures ranging from
Volume 9 Issue 6 (2023) 103 https://doi.org/10.36922/ijb.0244