
Page 23 - IJB-9-6
P. 23
International Journal of Bioprinting CFD analysis for multimaterial bioprinting conditions
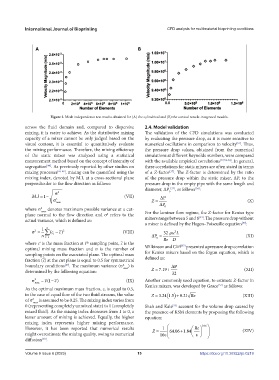
Figure 2. Mesh independence test results obtained for (A) the cylindrical and (B) the conical nozzle-integrated models.
across the fluid domain and, compared to dispersive 2.4. Model validation
mixing, it is easier to achieve. As the distributive mixing The validation of the CFD simulations was conducted
capacity of a mixer cannot be only judged based on the by evaluating the pressure drop, as it is more sensitive to
visual contour, it is essential to quantitatively evaluate numerical oscillations in comparison to velocity . Thus,
[51]
the mixing performance. Therefore, the mixing efficiency the pressure drop values, obtained from the numerical
of the static mixer was analyzed using a statistical simulations at different Reynolds numbers, were compared
measurement method based on the concept of intensity of with the available empirical correlations [37,52-54] . In general,
segregation . As previously reported by other studies on these correlations for static mixers are often stated in terms
[44]
mixing processes [45-49] , mixing can be quantified using the of a Z-factor . The Z-factor is determined by the ratio
[37]
mixing index, denoted by M.I, at a cross-sectional plane of the pressure drop within the static mixer, ΔP, to the
perpendicular to the flow direction as follows: pressure drop in the empty pipe with the same length and
diameter, ΔP [37] , as follows :
[54]
2 0
MI. 1 (VII) P
2 max Z P (X)
where σ 2 max denotes maximum possible variance at a cut- 0
plane normal to the flow direction and σ refers to the For the laminar flow regime, the Z-factor for Kenics type
2
[44]
actual variance, which is defined as: mixers range between 5 and 8 . The pressure drop without
a mixer is defined by the Hagen–Poiseuille equation :
[37]
1 n
2
c ( c) 2 (VIII) 32 uL
2
n i 1 i P (XI)
0
where c is the mass fraction at i sampling point, c is the Re D [37]
th
i
optimal mixing mass fraction and n is the number of Wilkinson and Cliff presented a pressure drop correlation
sampling points on the associated plane. The optimal mass for Kenics mixers based on the Ergun equation, which is
fraction (c) at the cut plane is equal to 0.5 for symmetrical defined as:
boundary conditions . The maximum variance (σ 2 max ) is P
[49]
determined by the following equation: Z 719. 32 (XII)
2 max c( 1 c) (IX) Another commonly used equation, to estimate Z-factor in
[52]
As the optimal maximum mass fraction, c, is equal to 0.5, Kenics mixers, was developed by Grace as follows:
in the case of equal flow of the two fluid streams, the value Z 3241. 5. 0 21. Re (XIII)
of σ 2 max is assumed to be 0.25. The mixing index varies from
0 (representing completely unmixed state) to 1 (completely Shah and Kale account for the volume drop caused by
[53]
mixed fluid). As the mixing index decreases from 1 to 0, a the presence of KSM elements by proposing the following
lesser amount of mixing is achieved. Equally, the higher equation:
mixing index represents higher mixing performance.
However, it has been reported that numerical results Z 1 64 06 184 Re 066. (XIV)
.
.
might overestimate the mixing quality, owing to numerical 16
diffusion .
[50]
Volume 9 Issue 6 (2023) 15 https://doi.org/10.36922/ijb.0219