
Page 25 - IJB-9-6
P. 25
International Journal of Bioprinting CFD analysis for multimaterial bioprinting conditions
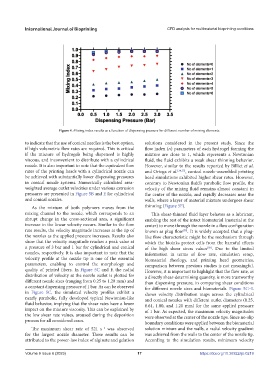
Figure 4. Mixing index results as a function of dispensing pressure for different number of mixing elements.
to indicate that the use of conical needles is the best option, solutions considered in the present study. Since the
if high volumetric flow rates are required. This is critical flow index (n) parameters of each hydrogel forming the
if the mixture of hydrogels being dispensed is highly mixture are close to 1, which represents a Newtonian
viscous, and inconvenient to distribute with a cylindrical fluid, the fluid exhibits a weak shear thinning behavior.
nozzle. It is also important to note that the equivalent flow However, similar to the results reported by Billiet et al.
rates of the printing heads with a cylindrical nozzle can and Ortega et al. [34,57] , conical nozzle-assembled printing
be achieved with substantially lower dispensing pressures head simulations exhibited higher shear rates. However,
in conical nozzle systems. Numerically calculated area- contrary to Newtonian fluid’s parabolic flow profile, the
weighted average outlet velocities under various extrusion velocity of the mixing fluid remains almost constant in
pressures are presented in Figure 5B and E for cylindrical the center of the nozzle, and rapidly decreases near the
and conical nozzles. walls, where a layer of material mixture undergoes shear
As the mixture of both polymers moves from the thinning (Figure 5F).
mixing channel to the nozzle, which corresponds to an This shear-thinned fluid layer behaves as a lubricant,
abrupt change in the cross-sectional area, a significant enabling the rest of the intact biomaterial (material at the
increase in the linear velocity occurs. Similar to the flow center) to move through the nozzle in a flow configuration
rate results, the velocity magnitude increases at the tip of known as plug flow . It is widely accepted that a plug-
[58]
the nozzles as the applied pressure increases. Results also like flow characteristic might be the mechanism through
show that the velocity magnitude reaches a peak value at which the bioinks protect cells from the harmful effects
a pressure of 3 bar and 1 bar for cylindrical and conical of the high shear stress values . Due to the limited
[58]
nozzles, respectively. It is also important to note that the information in terms of flow rate, simulation setup,
velocity profile at the nozzle tip is one of the essential biomaterial rheology, and printing head geometries,
parameters, enabling to control the morphology and comparison between previous studies is not meaningful.
quality of printed fibers. In Figure 5C and F, the radial However, it is important to highlight that the flow rate, as
distribution of velocity at the nozzle outlet is plotted for a directly shear-determining quantity, is more trustworthy
different nozzle sizes (ranging from 0.25 to 1.20 mm) and than dispensing pressure, in comparing shear conditions
a constant dispensing pressure of 1 bar. As can be observed for different nozzle sizes and biomaterials. Figure 5G–L
in Figure 5C, the simulated velocity profiles exhibit a shows velocity distribution maps across the cylindrical
nearly parabolic, fully developed typical Newtonian-like and conical nozzles with different outlet diameters (0.25,
fluid behavior, implying that the shear rates have a lower 0.61, 1.00, and 1.20 mm) for the same applied pressure
impact on the mixture viscosity. This can be explained by of 1 bar. As expected, the maximum velocity magnitudes
the low shear rate values, aroused during the deposition were observed at the center of the nozzle tips. Since no-slip
process for all considered cases.
boundary conditions were applied between the biomaterial
The maximum shear rate of 521 s was observed solution mixture and the walls, a radial velocity gradient
−1
for the largest nozzle diameter. These results can be was achieved from the walls to the center of the nozzle tip.
attributed to the power-law index of alginate and gelation According to the simulation results, minimum velocity
Volume 9 Issue 6 (2023) 17 https://doi.org/10.36922/ijb.0219