
Page 425 - IJB-9-6
P. 425
International Journal of Bioprinting Versatile pomelo peel-inspired structures
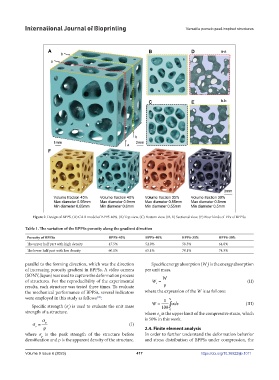
Figure 2. Design of BPPS. (A) CAD model of BPPS-40%. (B) Top view. (C) Bottom view. (D, E) Sectional view. (F) Four kinds of VFs of BPPSs.
Table 1. The variation of the BPPSs porosity along the gradient direction
Porosity of BPPSs BPPS-45% BPPS-40% BPPS-35% BPPS-30%
The upper half part with high density 47.5% 52.9% 58.5% 64.8%
The lower half part with low density 60.1% 65.1% 70.1% 74.3%
parallel to the forming direction, which was the direction Specific energy absorption (W ) is the energy absorption
s
of increasing porosity gradient in BPPSs. A video camera per unit mass.
(SONY, Japan) was used to capture the deformation process W
of structures. For the reproducibility of the experimental W = (II)
s
results, each structure was tested three times. To evaluate ρ
the mechanical performance of BPPSs, several indicators where the expression of the W is as follows:
were employed in this study as follows : 1 e 0
[39]
d
Specific strength (σ ) is used to evaluate the unit mass W = 100 ∫ σε (III)
s
0
strength of a structure. where e is the upper limit of the compressive strain, which
0
σ is 50% in this work.
σ = p (I)
s
ρ 2.4. Finite element analysis
where σ is the peak strength of the structure before In order to further understand the deformation behavior
p
densification and r is the apparent density of the structure. and stress distribution of BPPSs under compression, the
Volume 9 Issue 6 (2023) 417 https://doi.org/10.36922/ijb.1011