
Page 550 - IJB-9-6
P. 550
International Journal of Bioprinting 3D printing of PCL-ceramic composite scaffolds
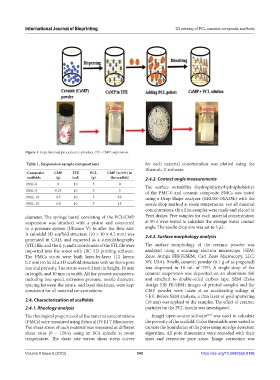
Figure 1. Experimental procedure to produce PCL-CMP suspension.
Table 1. Suspension sample compositions for each material concentration was plotted using the
Rheocalc T software.
Composite CMP TFE PCL CMP (w/w%) in
scaffolds (g) (ml) (g) the scaffold 2.4.2. Contact angle measurements
PMC-0 0 10 5 0 The surface wettability (hydrophilicity/hydrophobicity)
PMC-5 0.25 10 5 5 of the PMC-0 and ceramic composite PMCs was tested
PMC-10 0.5 10 5 10 using a Drop Shape analyzer (KRUSS-DSA25E) with the
PMC-15 1.0 10 5 15 sessile drop method at room temperature. For all material
concentrations, thin film samples were made and placed in
diameter. The syringe barrel consisting of the PCL/CMP Petri dishes. Five samples for each material concentration
suspension was attached with a piston and connected at 90 s were tested to calculate the average water contact
to a pressure system (Ultimus V) to alter the flow rate. angle. The sessile drop size was set to 5 μL.
A cuboidal 3D scaffold structure (10 × 10 × 0.2 mm) was 2.4.3. Surface morphology analysis
generated in CAD, and exported as a stereolithography
(STL) file, and the x, y, and z coordinates of the STL file were The surface morphology of the ceramic powder was
imported into the robot with JRC 3D printing software. analyzed using a scanning electron microscope (SEM;
The PMCs struts were built layer-by-layer (12 layers: Zeiss Auriga FIB/FESEM, Carl Zeiss Microscopy, LLC,
0.2 mm) to build a 3D scaffold structure with uniform pore NY, USA). Briefly, ceramic powder (0.1 g of as-prepared)
size and porosity. The struts were 0.2 mm in height, 10 mm was dispersed in 10 mL of TFE. A single drop of the
in length, and 10 mm in width. All the process parameters, ceramic suspension was deposited on an aluminum foil
including line speed, extrusion pressure, nozzle diameter, and attached to double-sided carbon tape. SEM (Zeiss
spacing between the struts, and layer thickness, were kept Auriga FIB FE-SEM) images of printed samples and the
consistent for all material concentrations. CMP powder were taken at an accelerating voltage of
5 kV. Before SEM analysis, a thin layer of gold sputtering
2.4. Characterization of scaffolds (10 nm) was applied to the samples. The effect of ceramic
2.4.1. Rheology analysis particles on the PCL matrix was investigated.
The rheological properties of all the material concentrations ImageJ open-source software was used to calculate
[57]
(PMCs) were measured using Rehocal DVIII T Rheometer. the porosity of the scaffold. Color thresholds were varied to
The shear stress of each material was measured at different capture the boundaries of the pores using an edge detection
shear rates (0 – 120/s) using an SC4 spindle at room algorithm. All pore dimensions were recorded with their
temperature. The shear rate versus shear stress curves sizes and respective pore areas. Image correction was
Volume 9 Issue 6 (2023) 542 https://doi.org/10.36922/ijb.0196