
Page 309 - v11i4
P. 309
International Journal of Bioprinting 3D scaffold prevents tendon ossification
were anesthetized with 3% sodium pentobarbital (0.8 eosin (H&E) for general tissue morphology; Safranin
mL/kg; intravenous). The skin and subcutaneous tissue O for proteoglycan/cartilage matrix visualization; and
of the hind paw heel were incised layer by layer to BMP-2 immunohistochemistry (IHC) using an anti-
expose the Achilles tendon, which was then transected BMP-2 primary antibody (ab214821; Abcam, UK) and
at its midportion using a scalpel. In the control group, 3,3’-diaminobenzidine chromogen.
the severed tendons were repaired directly with 4-0
absorbable sutures using a modified Kessler technique. 2.15. Hematological profiling
The subcutaneous tissue and skin were subsequently Systemic inflammatory and immune responses were
closed in layers with 3-0 absorbable sutures. In the scaffold assessed via complete blood count analysis (Sysmex, Japan)
group, appropriately sized scaffolds were sutured to the at days 3, 7, and 14 post-implantation. Key parameters
tendon stumps with 4-0 absorbable sutures prior to the included: leukocyte count (white blood cell [WBC];
12
9
layered closure of subcutaneous tissue and skin with 3-0 ×10 /L), erythrocyte count (red blood cell; ×10 /L),
9
absorbable sutures. This animal experiment was approved neutrophil count (×10 /L), neutrophil percentage,
9
by the Ethics Committee of Drum Tower Hospital, School lymphocyte count (×10 /L), lymphocyte percentage,
of Medicine, Nanjing University (No. 2021AE01031). monocyte count (×10 /L), monocyte percentage,
9
interleukin-6 concentration (IL-6), and tumor necrosis
2.13. Micro-computed tomography imaging for factor-α concentration (TNF-α).
heterotopic ossification quantification
Micro-computed tomography (CT) scanning (Skyscan, 2.16. Statistical analysis
Belgium) was performed on control, SF, and SF–HPC All data are expressed as mean ± standard deviation.
groups at 2, 4, and 8 weeks post-Achilles tendon transection Intergroup comparisons were analyzed using a one-way
to quantify HO volume. Scan parameters included a 65 kV analysis of variance with Tukey’s post-hoc test (for ≥3
source voltage, 300 μA current, and 18 μm isotropic voxel size. groups) or unpaired Student’s t-test (for two groups) using
Raw data were reconstructed using Mimics Research 20.0 GraphPad Prism 9.0. Significance thresholds were defined
(Materialise, Belgium), and HO volumes were segmented as: *p < 0.05, **p < 0.01, ***p < 0.001, ****p < 0.0001.
and calculated in Magics 25.0 (Materialise, Belgium) using a
fixed Hounsfield unit threshold (800–3000). 3. Results and discussion
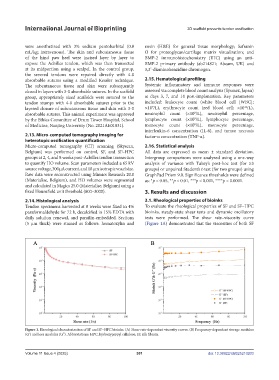
2.14. Histological analysis 3.1. Rheological properties of bioinks
Tendon specimens harvested at 8 weeks were fixed in 4% To evaluate the rheological properties of SF and SF–HPC
paraformaldehyde for 72 h, decalcified in 15% EDTA with bioinks, steady-state shear tests and dynamic oscillatory
daily solution renewal, and paraffin-embedded. Sections tests were performed. The shear rate–viscosity curve
(5 μm thick) were stained as follows: hematoxylin and (Figure 1A) demonstrated that the viscosities of both SF
Figure 1. Rheological characterization of SF and SF–HPC bioinks. (A) Shear rate-dependent viscosity curves. (B) Frequency-dependent storage modulus
(G’) and loss modulus (G’’). Abbreviations: HPC, hydroxypropyl cellulose; SF, silk fibroin.
Volume 11 Issue 4 (2025) 301 doi: 10.36922/IJB025210203