
Page 332 - v11i4
P. 332
International Journal of Bioprinting Nozzle geometry for enhanced cell viability
flow conditions. This dimensionless number quantifies Ca s G (IX)
26
the relative importance of fluid viscous stresses compared
to the elastic stresses of the particle. The expression for Ca e
depends on the type of flow. For example, in extensional where γ˙ is the shear rate.
flow, it is defined as: In the present study, both types of flow—extensional
and shear flows—are encountered. Additionally, a non-
Ca e ε G (VIII) dimensional residence time, τ , can be defined as:
s
t / t (X)
where G is the elastic modulus of the cell, and є˙ is the s s c
elongation rate.
Literature values, supported by compression tests where t is the actual residence time in the capillary
s
on immortalized human mesenchymal stem cells at and t is calculated by η/G, representing the characteristic
c
similar temperatures, 27,28 indicate an elastic modulus of timescale of the system.
approximately 1000 Pa for Y201 cells, which was used in The fraction of damaged cells can be effectively visualized
this analysis. While this value is an approximation due to as a function of the non-dimensional parameters described
the lack of specific mechanical characterization of Y201 earlier, as shown in Figure 7A. Data corresponding to
cells in the literature, it provides a reasonable estimate for a 90° contraction angle was excluded from the analysis
calculating dimensionless capillary numbers. In the case of because, in this scenario, Ca → ∞. In this plot, the color
e
shear flow, the Ca becomes: gradient represents the τ , and the planes were generated by
e
s
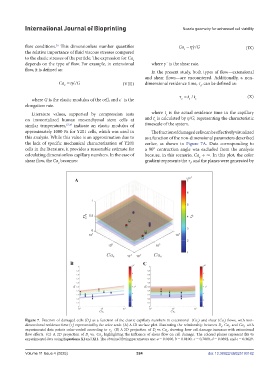
Figure 7. Fraction of damaged cells (D ) as a function of the elastic capillary numbers in extensional (Ca ) and shear (Ca ) flows, with non-
s
e
t
dimensional residence time (τ ) represented by the color scale. (A) A 3D surface plot illustrating the relationship between D , Ca , and Ca , with
s
e
s
t
experimental data points color-coded according to τ . (B) A 2D projection of D vs. Ca , showing how cell damage increases with extensional
t
s
e
flow effects. (C) A 2D projection of D vs. Ca , highlighting the influence of shear flow on cell damage. The colored planes represent fits to
s
t
experimental data using Equations XI and XII. The obtained fitting parameters are: a = 0.0100, b = 0.0100, c = 0.7000, d = 0.0892, and e = 0.3629.
Volume 11 Issue 4 (2025) 324 doi: 10.36922/IJB025190182