
Page 329 - v11i4
P. 329
International Journal of Bioprinting Nozzle geometry for enhanced cell viability
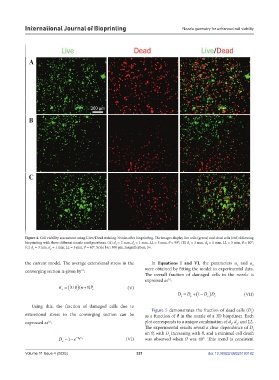
Figure 4. Cell viability assessment using Live/Dead staining 30 min after bioprinting. The images display live cells (green) and dead cells (red) following
bioprinting with three different nozzle configurations: (A) d = 3 mm, d = 1 mm, LL = 5 mm, θ = 90°; (B) d = 3 mm, d = 1 mm, LL = 5 mm, θ = 80°;
2
1
2
1
(C) d = 3 mm, d = 1 mm, LL = 5 mm, θ = 40°. Scale bar: 300 µm, magnification: 5×.
1 2
the current model. The average extensional stress in the In Equations I and VI, the parameters a and a
2
1
converging section is given by : were obtained by fitting the model to experimental data.
24
The overall fraction of damaged cells in the nozzle is
expressed as :
16
38/ ( n 1) P c (V)
e
D D 1 DD s (VII)
e
e
t
Using this, the fraction of damaged cells due to
Figure 5 demonstrates the fraction of dead cells (D )
t
extensional stress in the converging section can be as a function of θ in the nozzle of a 3D bioprinter. Each
expressed as : plot corresponds to a unique combination of d , d , and LL.
16
2
1
The experimental results reveal a clear dependence of D t
on θ, with D increasing with θ, and a minimal cell death
t
D 1 e a 2 e (VI) was observed when θ was 40°. This trend is consistent
e
Volume 11 Issue 4 (2025) 321 doi: 10.36922/IJB025190182