
Page 373 - v11i4
P. 373
International Journal of Bioprinting Sr-doped printed scaffolds for bone repair
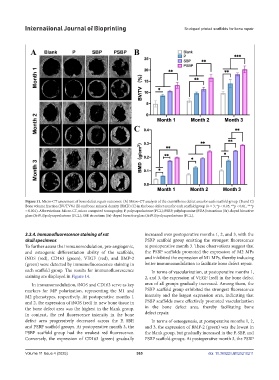
Figure 11. Micro-CT assessment of bone defect repair outcomes. (A) Micro-CT analysis of the cranial bone defect area for each scaffold group. (B and C)
Bone volume fraction (BV/TV%) (B) and bone mineral density (BMD) (C) in the bone defect area for each scaffold group (n = 3; *p < 0.05, **p < 0.01, ***p
< 0.001). Abbreviations: Micro-CT, micro computed tomography; P, polycaprolactone (PCL); PSBP, polydopamine (PDA)/strontium (Sr)-doped bioactive
glass (SrBG)/polycaprolactone (PCL); SBP, strontium (Sr)-doped bioactive glass (SrBG)/polycaprolactone (PCL).
3.3.4. Immunofluorescence staining of rat increased over postoperative months 1, 2, and 3, with the
skull specimens PSBP scaffold group emitting the strongest fluorescence
To further assess the immunomodulation, pro-angiogenic, at postoperative month 3. These observations suggest that
and osteogenic differentiation ability of the scaffolds, the PSBP scaffolds promoted the expression of M2 MPs
iNOS (red), CD163 (green), VEGF (red), and BMP-2 and inhibited the expression of M1 MPs, thereby inducing
(green) were detected by immunofluorescence staining in better immunomodulation to facilitate bone defect repair.
each scaffold group. The results for immunofluorescence In terms of vascularization, at postoperative months 1,
staining are displayed in Figure 14. 2, and 3, the expression of VEGF (red) in the bone defect
In immunomodulation, iNOS and CD163 serve as key area of all groups gradually increased. Among them, the
markers for MP polarization, representing the M1 and PSBP scaffold group exhibited the strongest fluorescence
M2 phenotypes, respectively. At postoperative months 1 intensity and the largest expression area, indicating that
and 2, the expression of iNOS (red) in new bone tissue in PSBP scaffolds more effectively promoted vascularization
the bone defect area was the highest in the blank group. in the bone defect area, thereby facilitating bone
In contrast, the red fluorescence intensity in the bone defect repair.
defect area progressively decreased across the P, SBP, In terms of osteogenesis, at postoperative months 1, 2,
and PSBP scaffold groups. At postoperative month 3, the and 3, the expression of BMP-2 (green) was the lowest in
PSBP scaffold group had the weakest red fluorescence. the blank group, but gradually increased in the P, SBP, and
Conversely, the expression of CD163 (green) gradually PSBP scaffold groups. At postoperative month 3, the PSBP
Volume 11 Issue 4 (2025) 365 doi: 10.36922/IJB025210211