
Page 405 - v11i4
P. 405
International Journal of Bioprinting Bioprinted liver dECM/GelMA tumor model
experimental groups. Statistical significance was indicated quantitative analysis of DNA and main biological
as follows: * p < 0.05, ** p < 0.01, *** p < 0.001. components, histological staining, and morphological
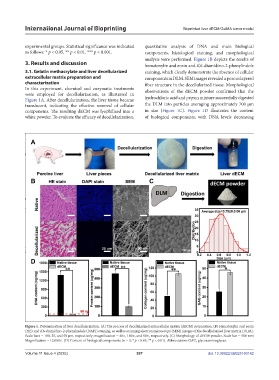
analysis were performed. Figure 1B depicts the results of
3. Results and discussion hematoxylin and eosin and 4’,6-diamidino-2-phenylindole
3.1. Gelatin methacrylate and liver decellularized staining, which clearly demonstrate the absence of cellular
extracellular matrix preparation and components in DLM. SEM images revealed a porous layered
characterization fiber structure in the decellularized tissue. Morphological
In this experiment, chemical and enzymatic treatments observations of the dECM powder confirmed that the
were employed for decellularization, as illustrated in
Figure 1A. After decellularization, the liver tissue became hydrochloric acid and pepsin mixture successfully digested
translucent, indicating the effective removal of cellular the DLM into particles averaging approximately 700 μm
components. The resulting dECM was lyophilized into a in size (Figure 1C). Figure 1D illustrates the content
white powder. To evaluate the efficacy of decellularization, of biological components, with DNA levels decreasing
Figure 1. Determination of liver decellularization. (A) The process of decellularized extracellular matrix (dECM) preparation. (B) Hematoxylin and eosin
(HE) and 4’,6-diamidino-2-phenylindole (DAPI) staining, as well as scanning electron microscopy (SEM) images of the decellularized liver matrix (DLM).
Scale bars = 100, 25, and 50 μm, respectively; magnification = 40×, 160×, and 80×, respectively. (C) Morphology of dECM powder. Scale bar = 500 nm;
Magnification = 12,000×. (D) Content of biological components (n = 3; * p < 0.05, ** p < 0.01). Abbreviation: GAG, glycosaminoglycan.
Volume 11 Issue 4 (2025) 397 doi: 10.36922/IJB025160142