
Page 410 - v11i4
P. 410
International Journal of Bioprinting Bioprinted liver dECM/GelMA tumor model
of the experimental group, which was consistent with measuring the size of the cell spheroids, it was determined
the cell proliferation activity. Together, the data showed that the average diameters of the 3D control group on days
that 3D-dECM in vitro model had better maintenance of 6 and 8 were 46.64 ± 6.38 and 54.37 ± 9.72 μm, respectively,
tumor metabolic activity when dECM was supplemented. whereas those of the 3D-dECM group were 67.41 ± 7.3
We propose that the dECM/GelMA bioink-constructed and 78.83 ± 9.41 μm, respectively (Figure S5, Supporting
in vitro 3D tumor model facilitates cell–ECM interactions Information). Under 2D culture conditions, the cells grew
and provides adequate space for cellular growth. as a monolayer without aggregation into cell spheres.
Thus, the inclusion of dECM promoted the growth of cell
3.6. Cellular morphological changes and liver spheres and facilitated the formation of larger cell spheres.
function expression These findings align with the results obtained from the
As depicted in Figure 6A, cells grown under 2D culture co-cultivation of cell materials and scratch experiments
conditions exhibited adherent growth to the surface with discussed in Section 3.4, where the presence of 5% dECM
plump morphology and rapid proliferation. In contrast, demonstrated enhanced interaction with cells, leading to
under 3D culture conditions, the cells gradually aggregated significant improvements in the growth, proliferation, and
and formed cell spheres. The addition of 5% dECM during migration of HepG2 cells.
the spheroid formation accelerated cell growth, with Liver function markers, such as ALT, AST, ALB,
numerous aggregates forming on day 4 and larger sphere and TBA, were significantly improved in the 3D
sizes observed. On day 6 of cultivation, numerous cell microenvironment, indicating a positive effect on liver
spheroids were evident in the 3D-dECM group (marked injury and pathological markers of liver cancer cells.
50
by red circles), while the 3D control group showed only The culture supernatants from three groups (2D, 3D
a few (marked by red arrows). By day 8, both groups control, and 3D-dECM) were analyzed, and the results
exhibited abundant cell spheroids under 3D culture were normalized to the 2D group to allow comparative
conditions (marked by red circles), with the 3D-dECM evaluation of liver-specific protein expression.
group demonstrating greater spheroid size and quantity. By Figures 6B–D and S8, Supporting Information illustrate the
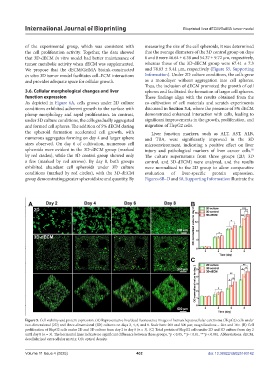
Figure 5. Cell viability and protein expression. (A) Representative live/dead fluorescence images of human hepatocellular carcinoma (HepG2) cells under
two-dimensional (2D) and three-dimensional (3D) cultures on days 2, 4, 6, and 8. Scale bars: 200 and 500 μm; magnifications = 20× and 10×. (B) Cell
proliferation of HepG2 cells under 2D and 3D culture from day 2 to day 8 (n = 3). (C) Total protein of HepG2 cells under 2D and 3D culture from day 2
until day 8 (n = 3). The horizontal lines indicate no significant difference between those groups. *p < 0.05, **p < 0.01, ***p < 0.001. Abbreviations: dECM,
decellularized extracellular matrix; OD, optical density.
Volume 11 Issue 4 (2025) 402 doi: 10.36922/IJB025160142