
Page 411 - v11i4
P. 411
International Journal of Bioprinting Bioprinted liver dECM/GelMA tumor model
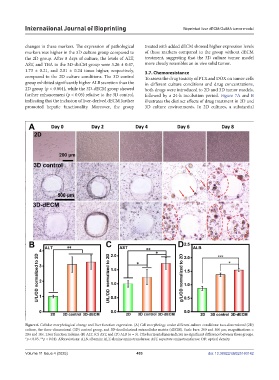
changes in these markers. The expression of pathological treated with added dECM showed higher expression levels
markers was higher in the 3D culture group compared to of these markers compared to the group without dECM
the 2D group. After 8 days of culture, the levels of ALT, treatment, suggesting that the 3D culture tumor model
AST, and TBA in the 3D-dECM group were 3.26 ± 0.47, more closely resembles an in vivo solid tumor.
1.73 ± 0.21, and 2.01 ± 0.24 times higher, respectively, 3.7. Chemoresistance
compared to the 2D culture conditions. The 3D control To assess the drug toxicity of PTX and DOX on tumor cells
group exhibited significantly higher ALB secretion than the in different culture conditions and drug concentrations,
2D group (p < 0.001), while the 3D-dECM group showed both drugs were introduced to 2D and 3D tumor models,
further enhancement (p < 0.05) relative to the 3D control, followed by a 24-h incubation period. Figure 7A and B
indicating that the inclusion of liver-derived dECM further illustrates the distinct effects of drug treatment in 2D and
promoted hepatic functionality. Moreover, the group 3D culture environments. In 2D cultures, a substantial
Figure 6. Cellular morphological change and liver function expression. (A) Cell morphology under different culture conditions: two-dimensional (2D)
culture, the three-dimensional (3D) control group, and 3D-decellularized extracellular matrix (dECM). Scale bars: 200 and 500 μm; magnifications =
20× and 10×. Liver function indexes: (B) ALT, (C) AST, and (D) ALB (n = 3). (The horizontal lines indicate no significant difference between those groups.
*p < 0.05, **p < 0.01). Abbreviations: ALB, albumin; ALT, alanine aminotransferase; AST, aspartate aminotransferase; OD, optical density.
Volume 11 Issue 4 (2025) 403 doi: 10.36922/IJB025160142