
Page 412 - v11i4
P. 412
International Journal of Bioprinting Bioprinted liver dECM/GelMA tumor model
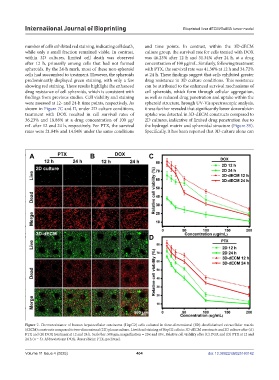
number of cells exhibited red staining, indicating cell death, and time points. In contrast, within the 3D-dECM
while only a small fraction remained viable. In contrast, culture group, the survival rate for cells treated with DOX
within 3D cultures, limited cell death was observed was 46.23% after 12 h and 31.34% after 24 h, at a drug
after 12 h, primarily among cells that had not formed concentration of 100 µg/mL. Similarly, following treatment
spheroids. By the 24-h mark, most of these non-spheroid with PTX, the survival rate was 41.36% at 12 h and 34.72%
cells had succumbed to treatment. However, the spheroids at 24 h. These findings suggest that cells exhibited greater
predominantly displayed green staining, with only a few drug resistance in 3D culture conditions. This resistance
showing red staining. These results highlight the enhanced can be attributed to the enhanced survival mechanisms of
drug resistance of cell spheroids, which is consistent with cell spheroids, which form through cellular aggregation,
findings from previous studies. Cell viability and staining as well as reduced drug penetration and uptake within the
were assessed at 12- and 24-h time points, respectively. As spheroid structure. hrough UV-Vis spectroscopic analysis,
shown in Figure 7C and D, under 2D culture conditions, it was further revealed that significantly lower doxorubicin
treatment with DOX resulted in cell survival rates of uptake was detected in 3D-dECM constructs compared to
36.23% and 18.88% at a drug concentration of 100 µg/ 2D cultures, indicative of limited drug penetration due to
mL after 12 and 24 h, respectively. For PTX, the survival the hydrogel matrix and spheroidal structure (Figure S9).
rates were 21.04% and 14.04% under the same conditions Specifically, it has been reported that 3D culture alone can
Figure 7. Chemoresistance of human hepatocellular carcinoma (HepG2) cells cultured in three-dimensional (3D)-decellularized extracellular matrix
(dECM) constructs compared to two-dimensional (2D) planar culture. Live/dead staining of HepG2 cells in 3D-dECM constructs and 2D culture after (A)
PTX and (B) DOX treatment at 12 and 24 h. Scale bar: 500 μm; magnification = 20× and 10×. Relative cell viability after (C) DOX and (D) PTX at 12 and
24 h (n = 3). Abbreviations: DOX, doxorubicin; PTX, paclitaxel.
Volume 11 Issue 4 (2025) 404 doi: 10.36922/IJB025160142