
Page 409 - v11i4
P. 409
International Journal of Bioprinting Bioprinted liver dECM/GelMA tumor model
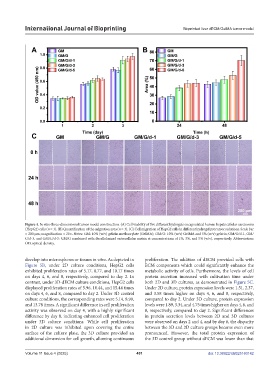
Figure 4. In vitro three-dimensional tumor model construction. (A) Cell viability of five different hydrogels encapsulated human hepatocellular carcinoma
(HepG2) cells (n = 3). (B) Quantification of the migration area (n = 3). (C) Cell migration of HepG2 cells in different hydrogel precursor solutions. Scale bar
= 200 μm; magnification = 20×. Notes: GM: 10% (w/v) gelatin methacrylate (GelMA); GM/G: 10% (w/v) GelMA and 5% (w/v) gelatin; GM/G/d-1, GM/
G/d-3, and GM/G/d-5: GM/G combined with decellularized extracellular matrix at concentrations of 1%, 3%, and 5% (w/v), respectively. Abbreviation:
OD, optical density.
develop into microspheres or tissues in vitro. As depicted in proliferation. The addition of dECM provided cells with
Figure 5B, under 2D culture conditions, HepG2 cells ECM components which could significantly enhance the
exhibited proliferation rates of 5.17, 8.77, and 10.17 times metabolic activity of cells. Furthermore, the levels of cell
on days 4, 6, and 8, respectively, compared to day 2. In protein secretion increased with cultivation time under
contrast, under 3D-dECM culture conditions, HepG2 cells both 2D and 3D cultures, as demonstrated in Figure 5C.
displayed proliferation rates of 5.96, 10.44, and 15.44 times Under 2D culture, protein expression levels were 1.51, 2.37,
on days 4, 6, and 8, compared to day 2. Under 3D control and 3.58 times higher on days 4, 6, and 8, respectively,
culture conditions, the corresponding rates were 5.14, 8.99, compared to day 2. Under 3D culture, protein expression
and 13.78 times. A significant difference in cell proliferation levels were 1.89, 3.34, and 4.75 times higher on days 4, 6, and
activity was observed on day 4, with a highly significant 8, respectively, compared to day 2. Significant differences
difference by day 8, indicating enhanced cell proliferation in protein secretion levels between 2D and 3D cultures
under 3D culture conditions. While cell proliferation were observed on days 2 and 4, and by day 8, the disparity
in 2D culture was inhibited upon covering the entire between the 3D and 2D culture groups became even more
surface of the culture plate, the 3D culture provided an pronounced. However, the total protein expression of
additional dimension for cell growth, allowing continuous the 3D control group without dECM was lower than that
Volume 11 Issue 4 (2025) 401 doi: 10.36922/IJB025160142