
Page 155 - IJOCTA-15-1
P. 155
Modeling the renewable energy development in T¨urkiye with optimization
Table 7. b 1 , b 2 , b 3 , b 4 and b 0 for MLR and MAEOPT in Case 3
Method b 1 b 2 b 3 b 4 b 0
MLR 0.00835235 -11324.65872369 9.21948719 -0.01018176 198494.85587163
MAEOPT 0.00847980 -11386.49005717 11.20276252 -0.01774047 195045.26896040
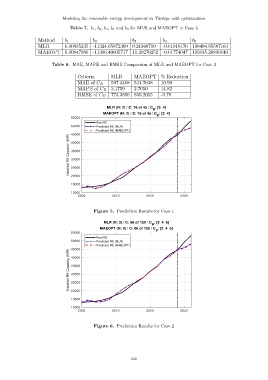
Table 8. MAE, MAPE and RMSE Comparison of MLR and MAEOPT for Case 3
Criteria MLR MAEOPT % Reduction
MAE of C B 597.4468 531.7638 10.99
MAPE of C B 3.1759 2.7050 14.82
RMSE of C B 774.3896 850.2015 -9.78
MLR (N: 2) / C: 18 of 45 / C : [3 4]
B
MAEOPT (N: 2) / C: 18 of 45 / C : [3 4]
B
55000
Real RE
50000 Predicted RE (MLR)
Predicted RE (MAEOPT)
45000
Installed RE Capacity (MW) 35000
40000
30000
25000
20000
15000
10000
2005 2010 2015 2020
Figure 5. Prediction Results for Case 1
MLR (N: 3) / C: 66 of 120 / C : [3 4 6]
B
MAEOPT (N: 3) / C: 66 of 120 / C : [3 4 6]
B
55000
Real RE
50000 Predicted RE (MLR)
Predicted RE (MAEOPT)
45000
Installed RE Capacity (MW) 35000
40000
30000
25000
20000
15000
10000
2005 2010 2015 2020
Figure 6. Prediction Results for Case 2
149